Your goal for the labs in this chapter is simply to unpack the code for further analysis. For each lab, you should try to unpack the code so that other static analysis techniques can be used. While you may be able to find an automated unpacker that will work with some of these labs, automated unpackers won’t help you learn the skills need when you encounter custom packers. Also, once you master unpacking, you may be able to manually unpack a file in less time than it takes to find, download and use an automated unpacker.
Each lab is a packed version of a lab from a previous chapter. Your task in each case is to unpack the lab and identify the chapter in which it appeared. The files are Lab18-01.exe and Lab18-05.exe
Lab18-01.exe
Initial Analysis
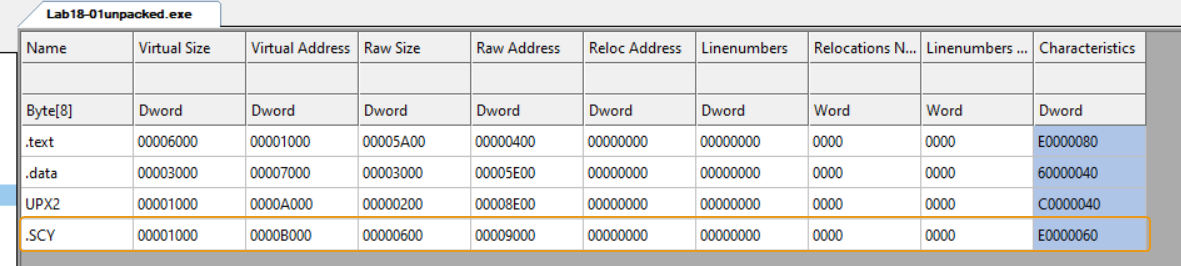
Statically analyzing the sample, we can see that it has a section called UPX2 which indicates that this malware is packed with UPX.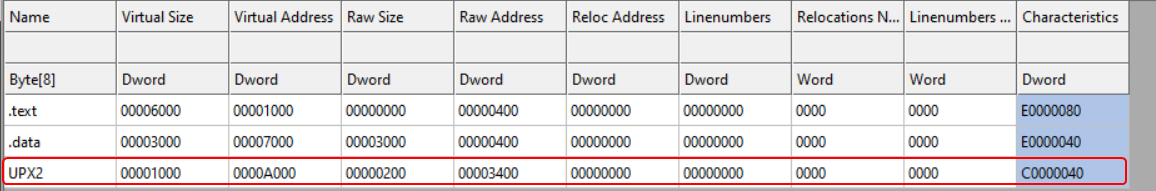
Using DiE (Detect it Easy), we can see some heuristics about the packer:
It tells us that it is indeed UPX but modified, that means if we try to use the UPX executable to try to automatically unpack this sample, it’ll not work.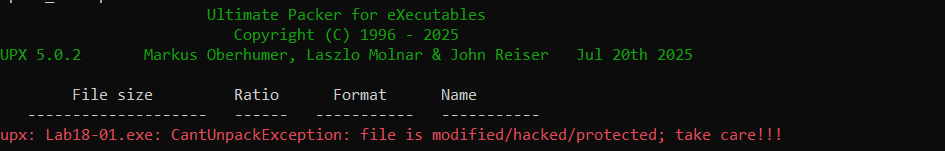
That means we’ll have to manually unpack it.
Manual Unpacking
Loading the program in x64dbg and landing on the entry point of the packed program, we can deduce that we’ve most likely landed on the unpacking stub, since most functions normally start with a stack prologue while this starts with pushad.
So our plan to unpacking this malware is:
Finding the OEP
Since we’re dealing with a UPX packer, chances are it’s using a tail jump at the end of the unpacking stub. And indeed we see a jmp instruction to a target in the .text section with 0x8a1d bytes difference of the current EIP, not to mention that after the tail jump we notice null bytes which indicates section padding. All of this confirm that this is the tail jump that points to the OEP.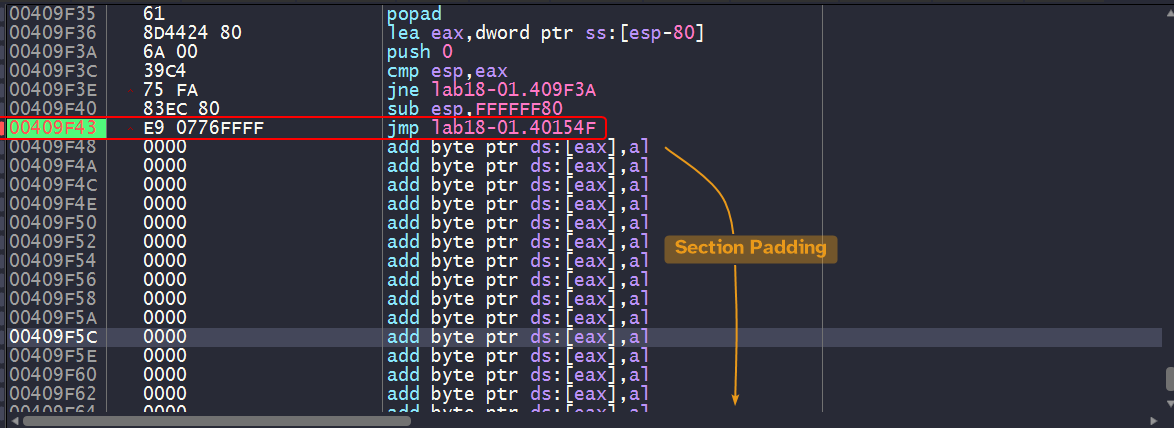
Import Table Reconstruction
Now that we have obtained the OEP, we can easily dump the debugged process using Scylla plugin which is a builtin plugin.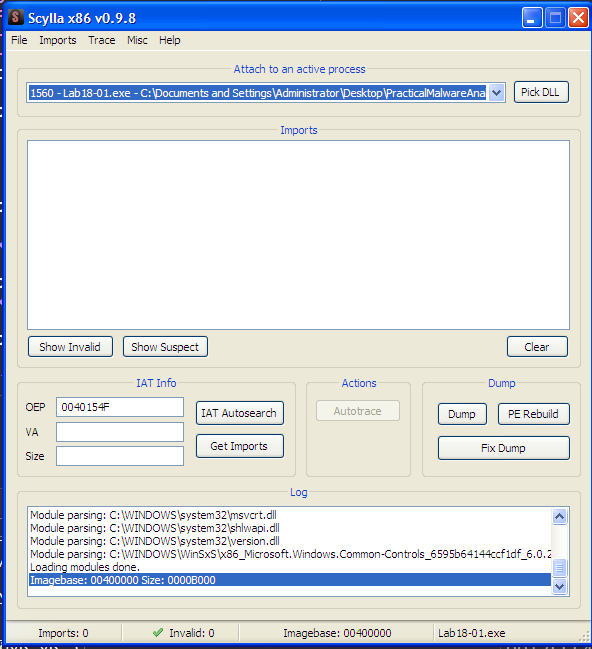
We can dump the process using the Dump button. We dump the process with a new entry point of 0x154F which is the RVA to the OEP.
Clicking IAT Autosearch, the plugin searches for the IAT in the debugged process and attempts to resolve them and obtain their names so that we can modify the dumped process’ PE header and reconstruct the import address table.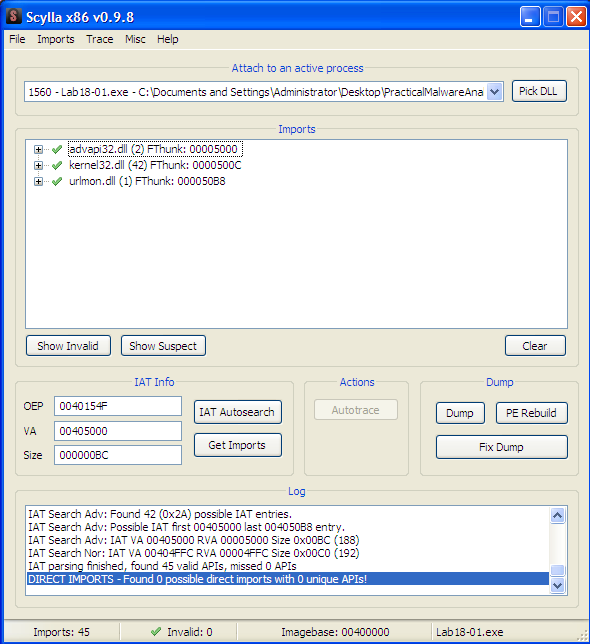
The plugin reports that the VA (Virtual Address) of the IAT is at 0x405000, so if we double check in the debugger in a memory view: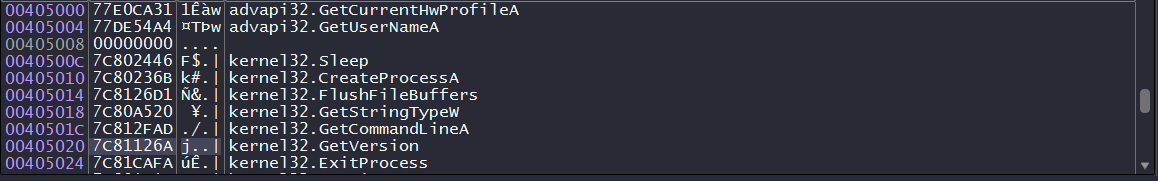
It does indeed contain the resolved pointers to each imported function, so that means we’re on the right track!
Keep in mind
We can also get to the IAT by double clicking any call instruction that has an imported function as a target and scroll up till we see the start of the IAT.
Clicking on Fix Dump allows us to fix the dumped process’ PE header (we can select it through the popup menu) so that it resolves the import directory by creating a new section .SCY that contains the new import directory and then modifies the PE header so that the data directory entry related to the import directory RVA now contains the RVA to the newly created .SCY section, and with that the sample is unpacked!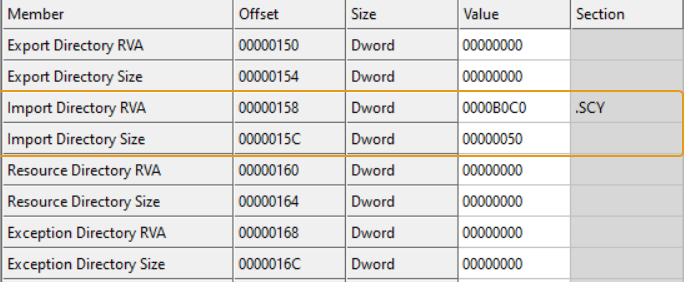
Static Analysis
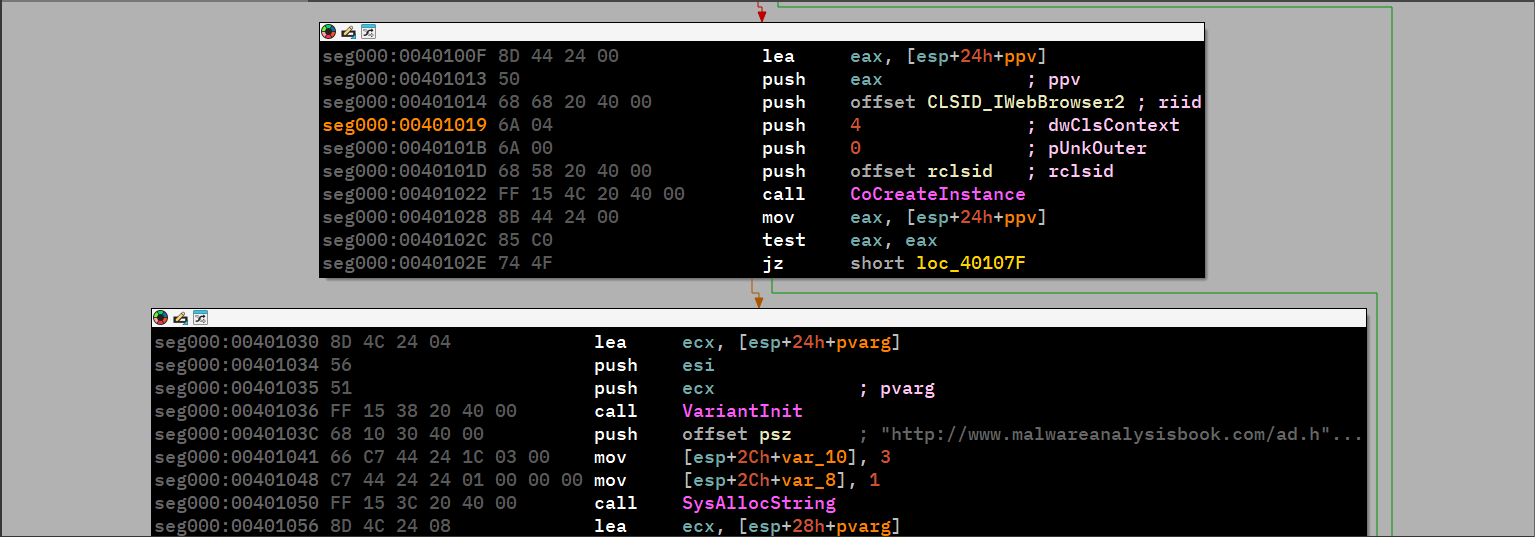
Now that the sample’s been unpacked, we can easily load this in IDA and see what it does: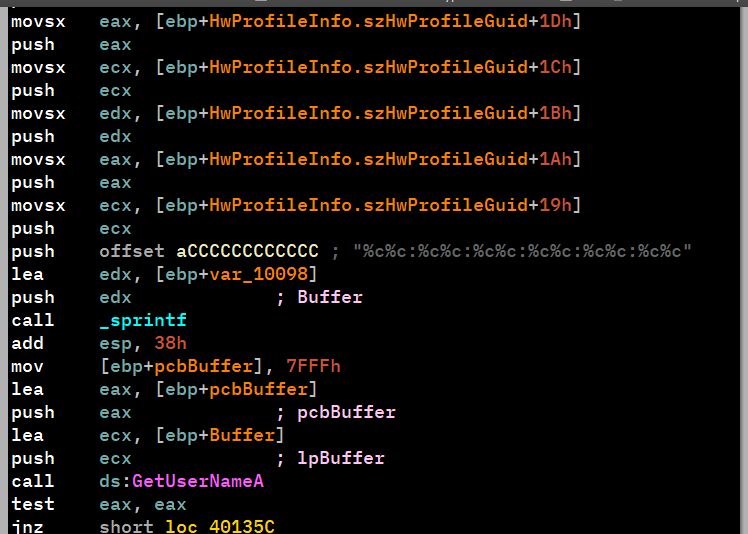
This is incredibly similar to Lab14-01.exe question.
Lab18-02.exe
Initial Analysis
Loading the sample into DiE, we find nothing worth of interest, only that it tells us that it is packed with “strange sections”.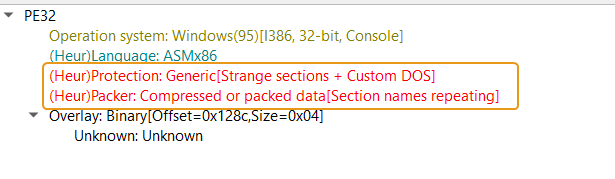
Using PEiD, we can infer on the name of the packer which turns out to be FSG 1.0 -> dulek/xt.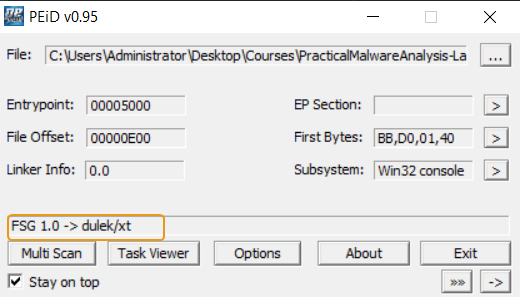
Searching online for any automated unpackers gives no results which means we’ll have to manually unpack this sample.
Manual Unpacking
Browsing through the unpacking stub, we find nothing particular of interest, even if we browse to the end of the stub, we don’t find a tail jump either.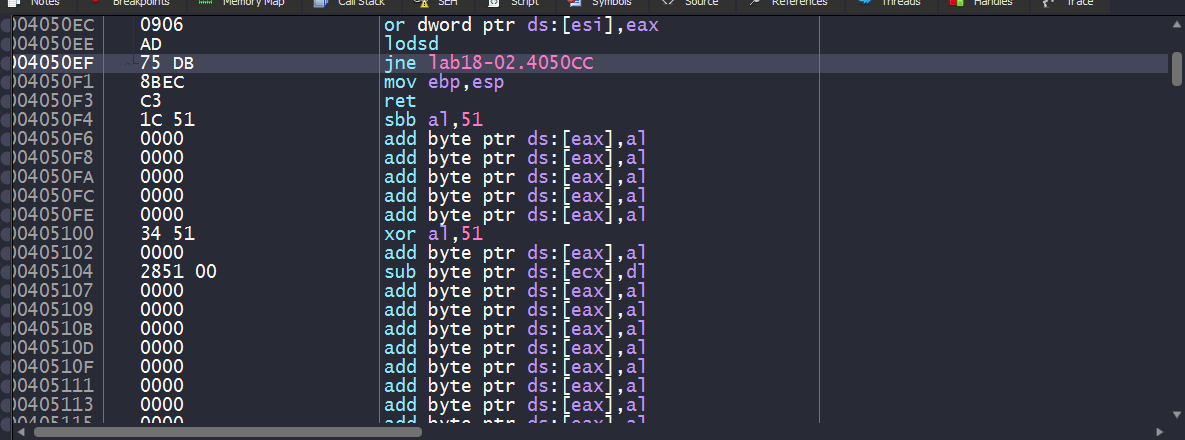
Searching through the jump instructions within the unpacking stub, we see one particular jump instruction that has a target address of a big difference with the unpacking stub’s normal address range (405000~4050EF) which is a good candidate for the OEP.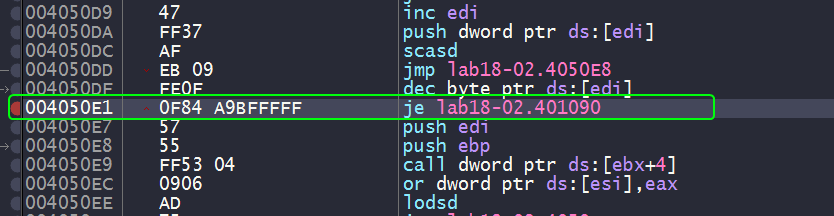
And indeed if we set a breakpoint to that location, we can see what seems to be a function prologue.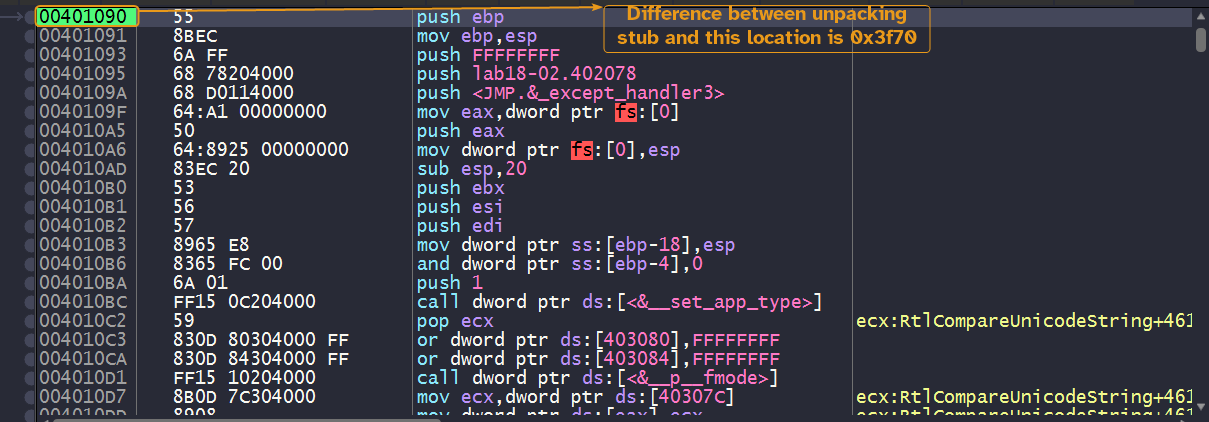
And it seems that we have found the OEP, all what’s left now is to dump the process and reconstruct the import table exactly as shown as the the previous lab.
Please note
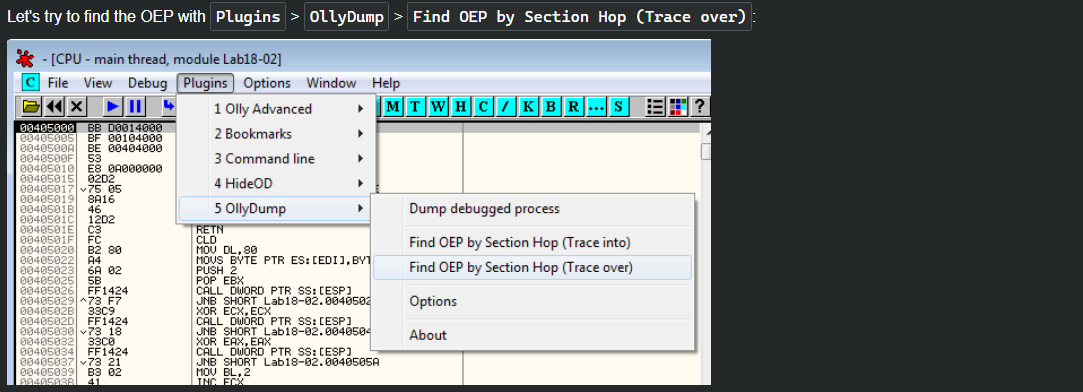
We can also get to the same address by using the Find OEP by Section Hop feature in OllyDbg, but x64dbg’s OllyDumpEx extension doesn’t support this feature and I’ve tried using the Trace into feature in x64dbg but I don’t know the valid constraints for breaking here.
Static Analysis
This looks very reminiscent of Lab07-02.exe.
Lab18-03.exe
Initial Analysis
Loading this binary into DiE, we can see that it marks it as packed by PECompact (1.68-1.84)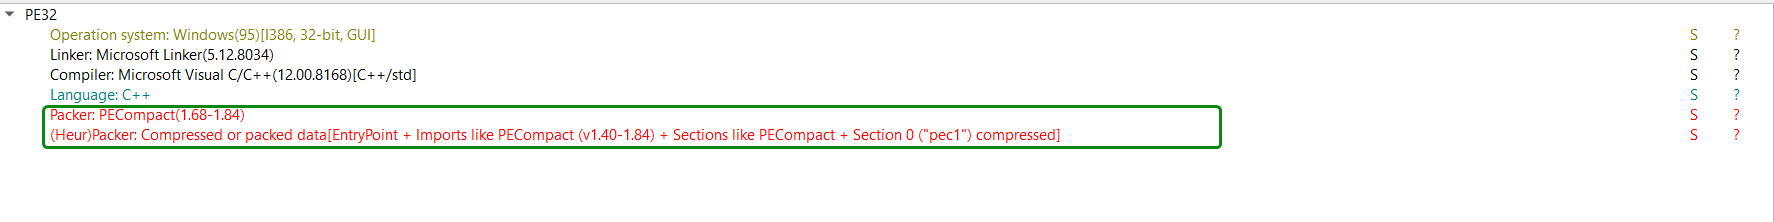
Searching online for an unpacker yields nothing, so we’ll have to manually unpack this binary.
Quick note here: the binary is actually a GUI application (Windows GUI subsystem)
Finding the OEP
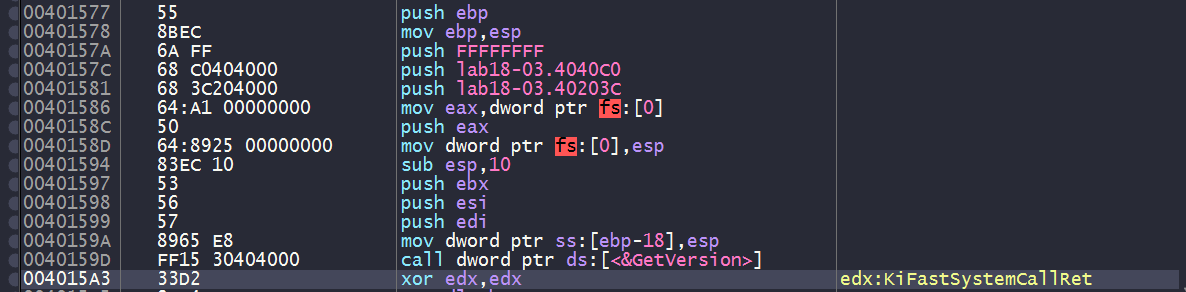
Loading the binary in x64dbg, we can see that the unpacking stub starts with pushfd (push flag register doubleword) and pushad (push all doubleword)
which pushes both flag and general purpose registers onto the stack.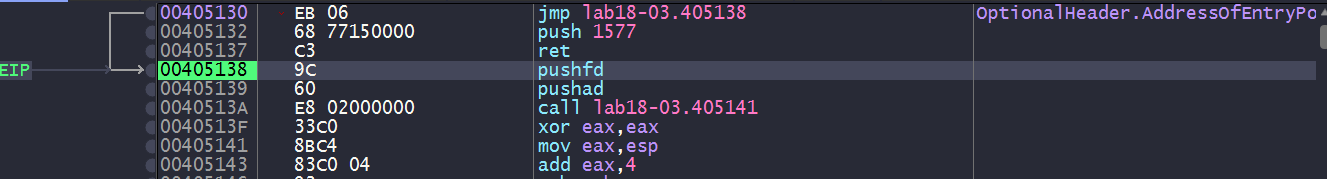
Checking the end of the unpacking stub gives nothing worth of information.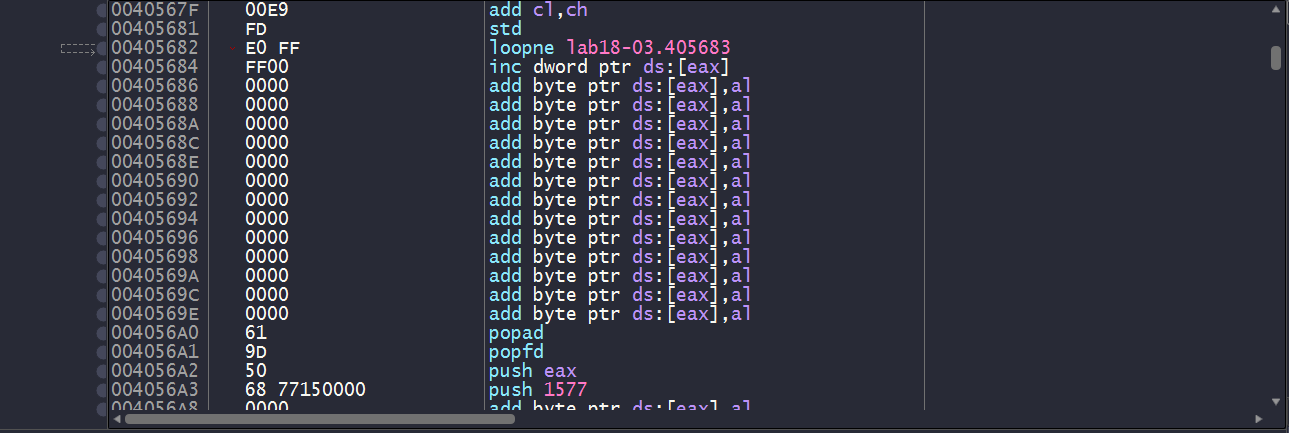
So we have one of two approaches here:
- Make use of the first two instructions.
- Make use of the fact that the binary is a GUI application.
After obtaining the OEP from both methods, we can then dump the process and reconstruct the import table as per usual.
Method 1: Instructions
Since we’ve established that the unpacking stub begins with a pushfd and pushad instructions then chances are that the unpacking stub ends with a popfd and popad instructions which access the stack location where the register contents were pushed, so we can set a hardware breakpoint on that location to be triggered upon access.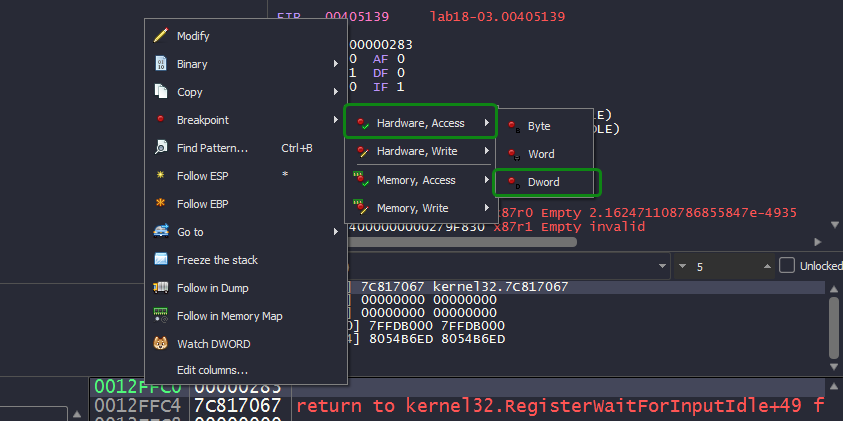
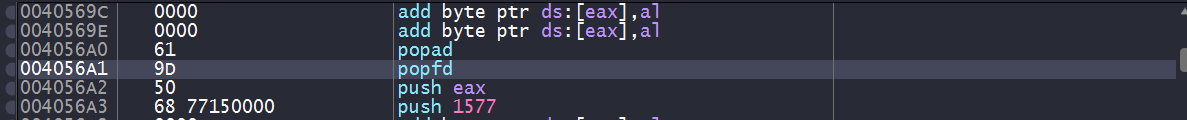
And indeed, we see ourselves landing at an instruction after popfd has access the memory location, we also a push instruction that has a target address with big difference with respect to the unpacking stub’s address range which is a perfect candidate for a OEP.
And indeed, we see ourselves landing in function prologue which means that we have found our OEP!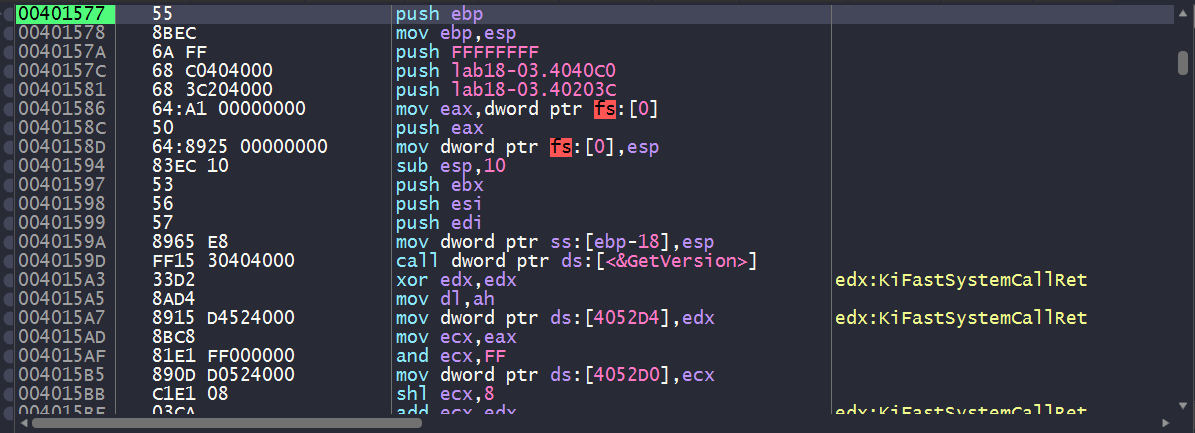
A common mistake
When you’re dealing with unpacking stubs, chances are that it is using all sorts of anti-reverse-engineering techniques which includes anti-disassembly techniques. Now you might want to search the entire binary for
popador apopfdand set a breakpoint there, but that might not work because you don’t know for sure that these are genuine instructions or not and it might not be hit.
Setting a software breakpoint in this exact location was not hit due to it inserting anint3trap instruction as opposed to aretinstruction when we use the hardware breakpoint instead.

Method 2: GUI Application
Since this binary is a GUI application, we can set a software breakpoint to GetModuleHandleA and GetVersion since they’re the first functions that get executed after the binary’s been unpacked.
We’ll have to set a breakpoint to the first instruction of these functions, not the call instructions whose target are the functions themselves.
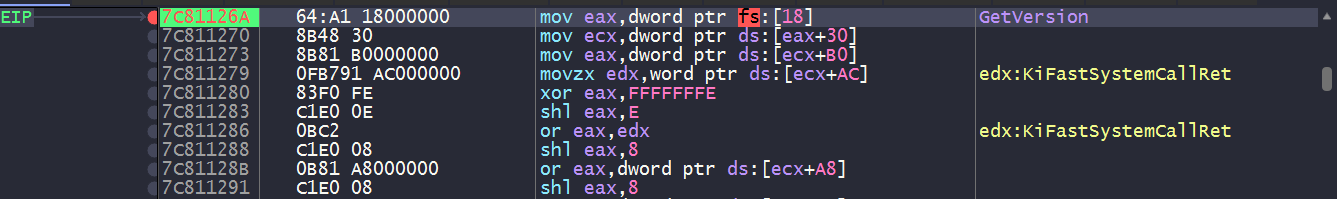
We landed at GetVersion(), we can then inspect the stack and check the return address of the caller.
And with that, we land at a location close to the OEP.
Static Analysis
This sample is similar to Lab09-02.exe.
Lab18-04.exe
Initial Analysis
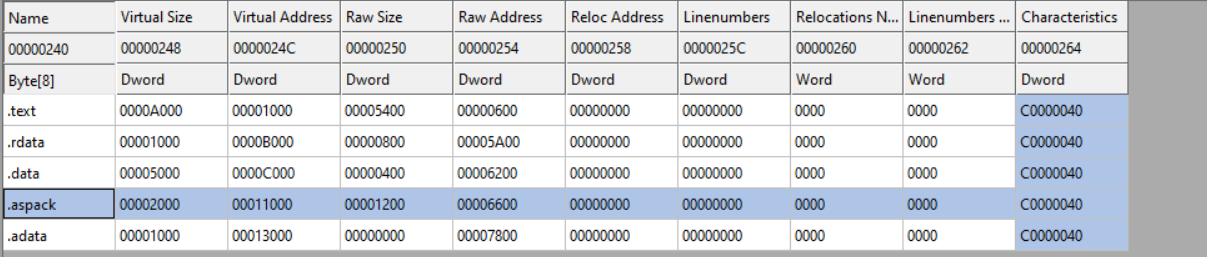
Loading the binary in DiE, it reports that the malware is packed with ASPack(2.12-2.42).
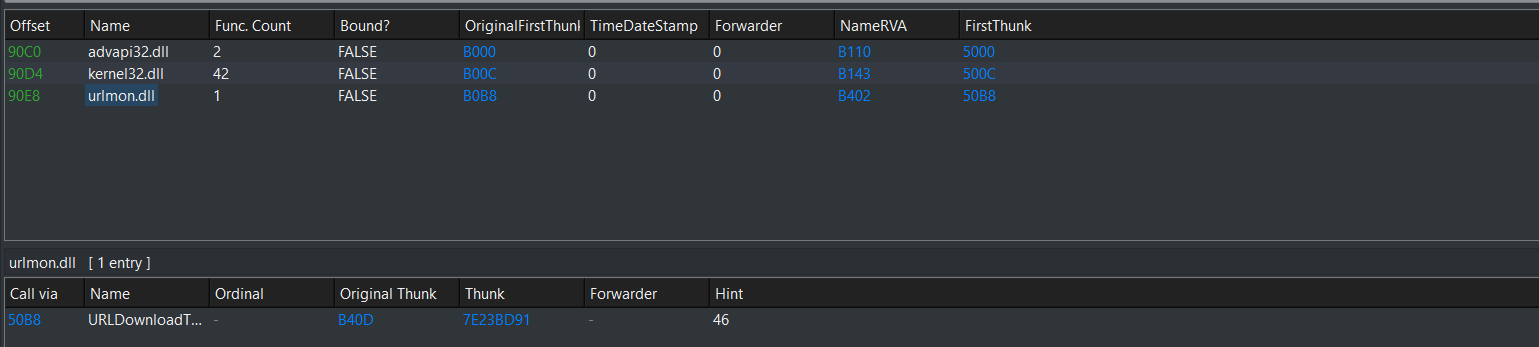
We can also see some imports from ws2_32.dll, shell32.dll, etc..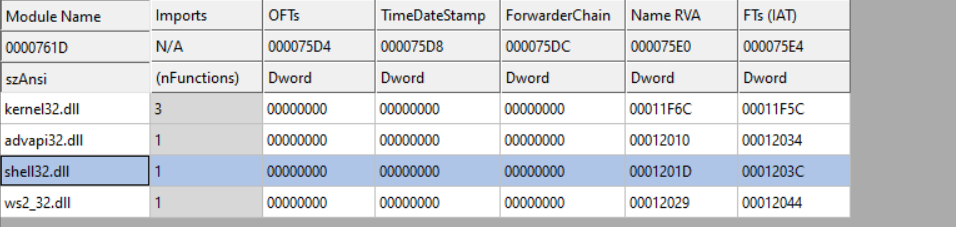
Lastly, we can see the presence of a .aspack section in the section headers, so it is confirmed that we’re dealing with ASPack.
This section also contains the packer’s entry point and import directory.
Manual Unpacking
Loading the packed sample into IDA, we can see that the entry point starts with a pusha instruction, similar to what we’ve seen in Lab18-03.exe.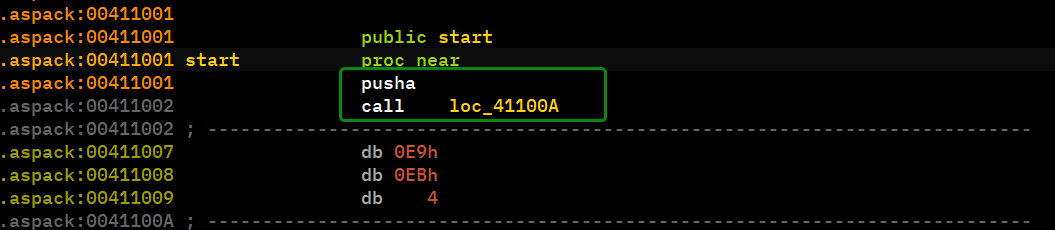
We can follow the hardware breakpoint method here, because it is very likely that the unpacking process finishes with a popa instruction.
We see that the program is gonna take a jump to the push instruction which in turn should get us to the what appears to be a perfect candidate for an OEP.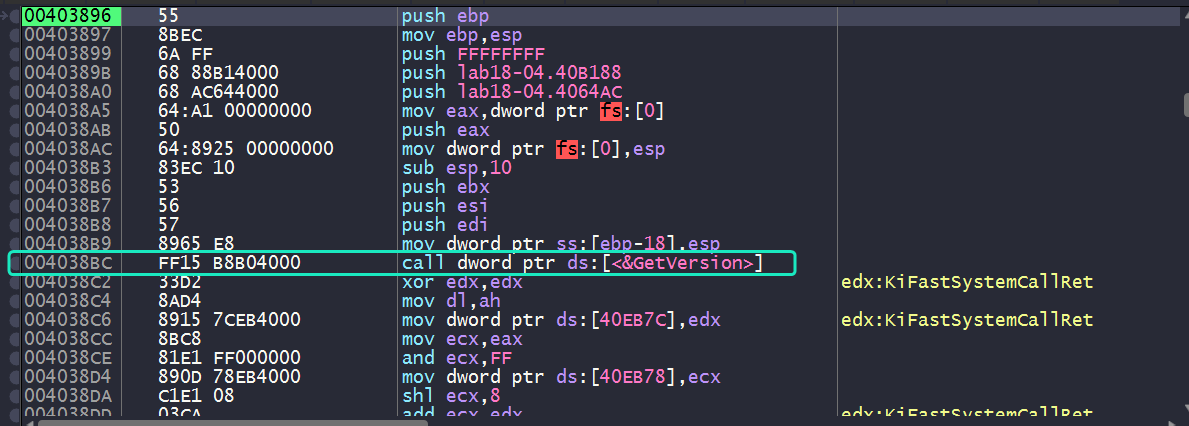
We can see what appears to be a function prologue not to mention the call to GetVersion() highlighted in cyan, so it seems we have found our OEP.
Note that the second method will also work in this case since it is a console application.
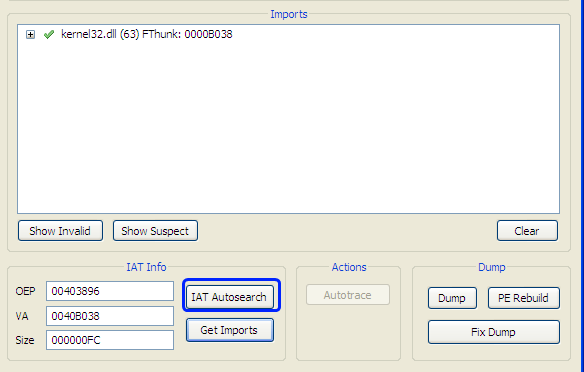
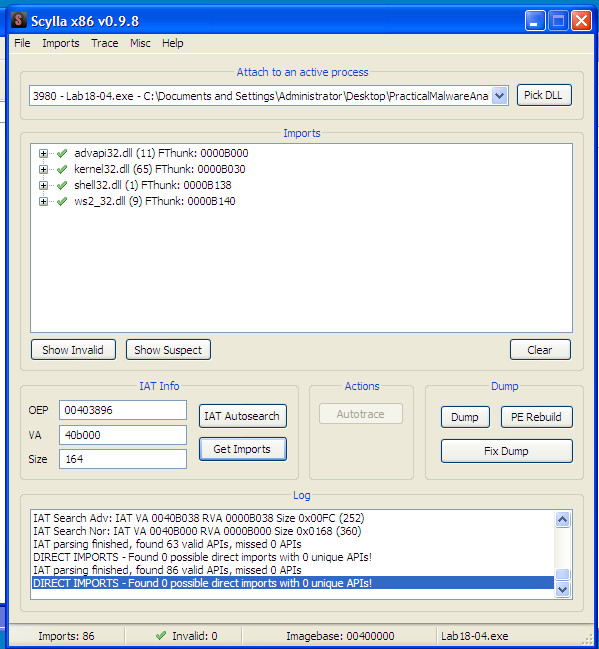
Now all what’s left is to reconstruct the import table.
Please note
During the reconstruction phase, Scylla might not be able to detect all import functions using IAT Autosearch.
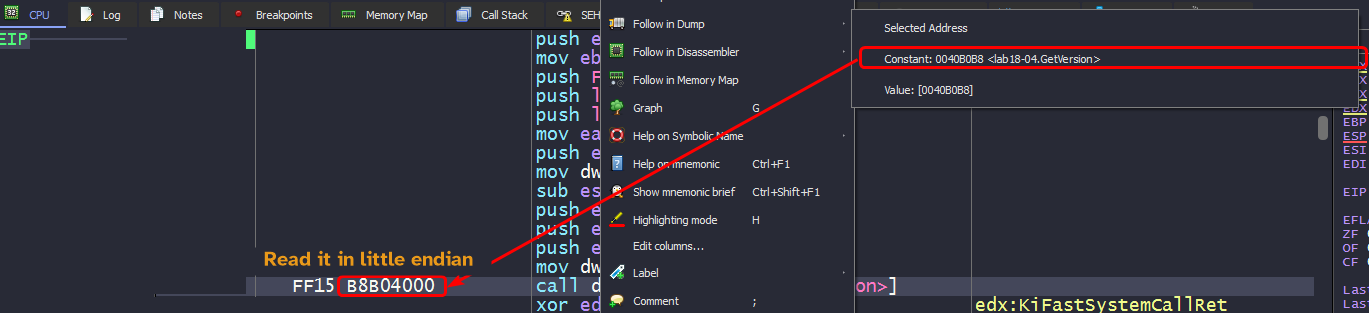
In such cases you’ll have to manually search for the IAT, usually by tracing down any call to an import function and view the constant value associated with thecallinstruction opcode.
From there, we land at the IAT itself that lead to each imported function. so we can scroll up until we find the first entry and keep a note of that address. We also need to obtain the size of the entire IAT so we’ll have to subtract the address of the last imported function’s address to the first one.
From this, we can obtain all of the imports of the sample and reconstruct it.

Static Analysis
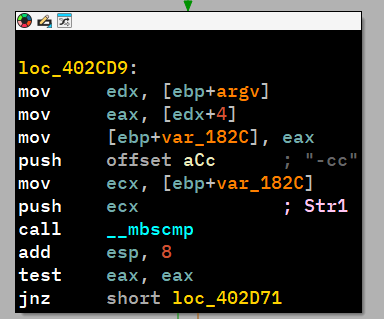
This sample looks very similar to Lab09-01.exe.
Lab18-05.exe
Initial Analysis
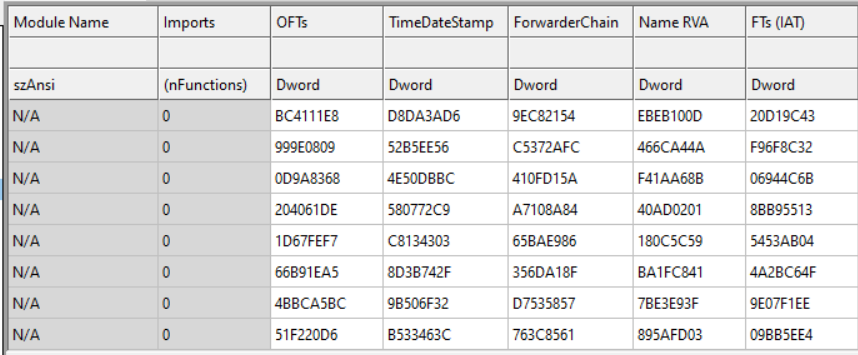
Loading the binary in DiE, we can see the binary packed with WinUpack 0.39 Final.
The import directory is all scrambled up and so are the section names of the binary.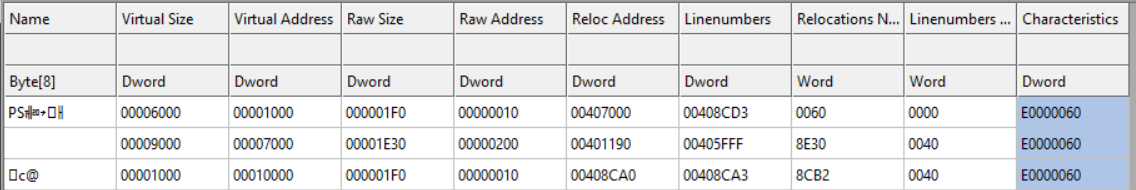
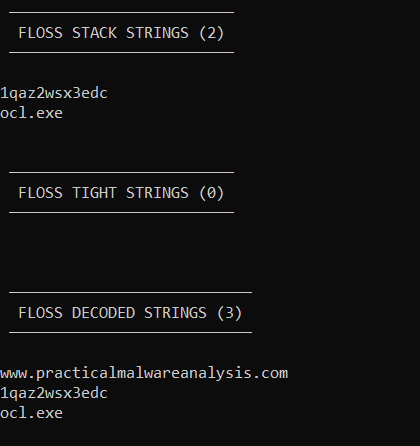
Automated Unpacking
Using PE Explorer, we’re able to determine that the OEP for the sample is 0x401190 and does all the unpacking for us, all we have to do is save the file.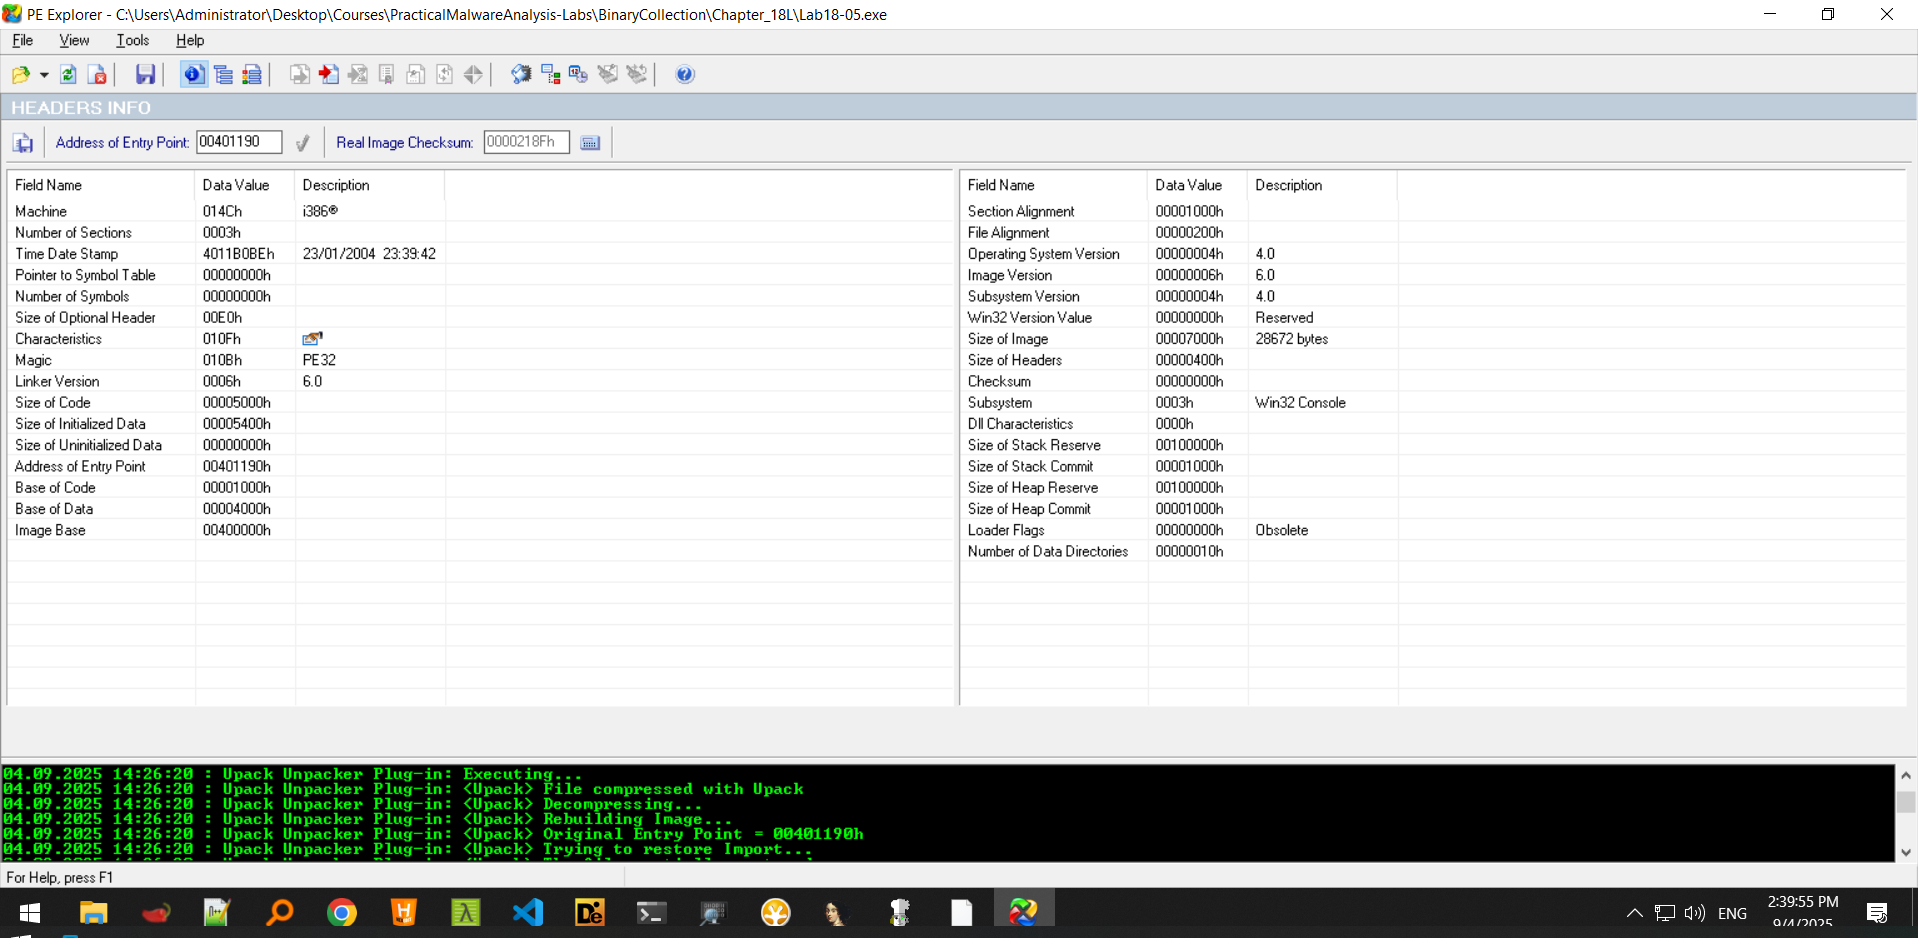
Now that we have the file unpacked, we can load it into IDA.
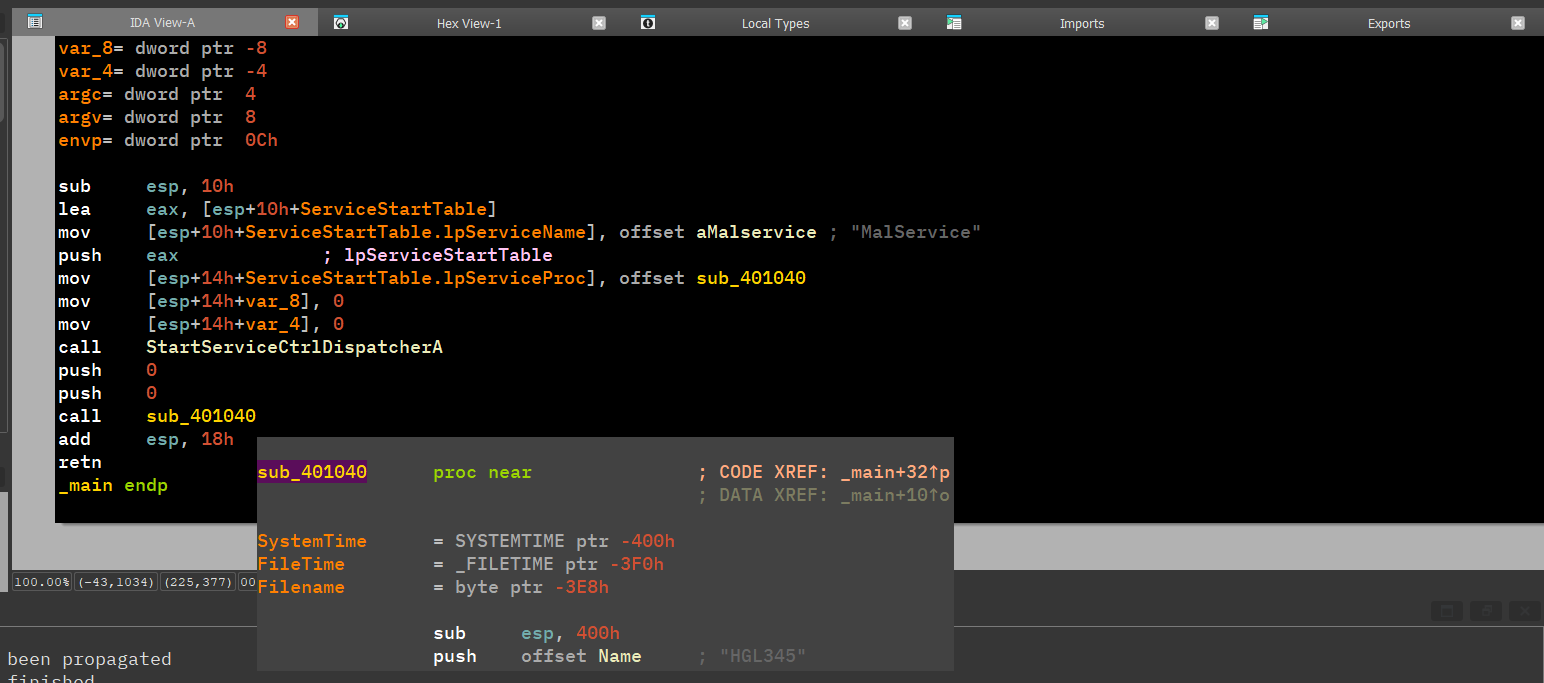
This is very similar to Lab07-01.exe.
Manual Unpacking
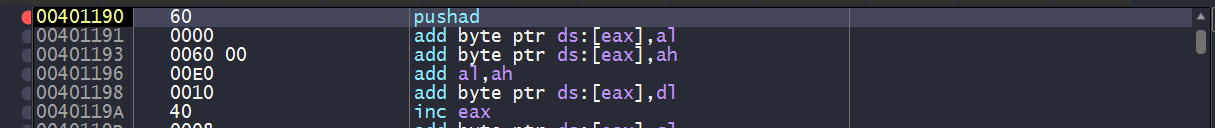
Loading the packed sample into x64dbg, we land at the packer’s entry point.
Scrolling the unpacking stub, we don’t find a tail jump or anything indicative of the packed section, so we can only follow one approach and that is to set a breakpoint on the first instruction of GetVersion() and check the function that called it.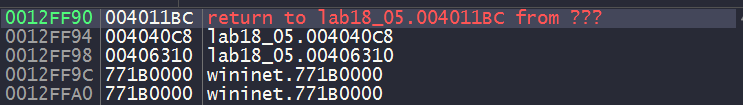
Checking the return address, we can see that we’ve indeed landed in the vicinity of the OEP.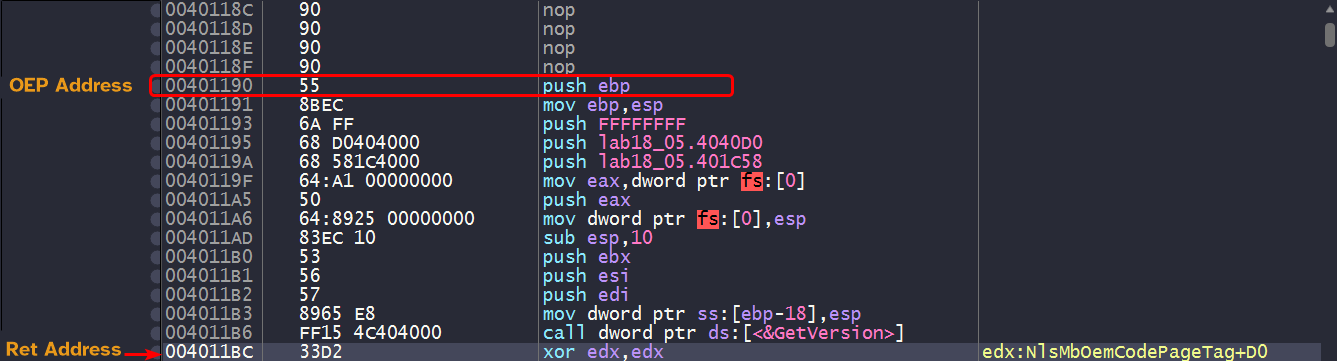
But reconstruction might fail as the IAT is not inside the PE image which can indicate that it is loading this dynamically.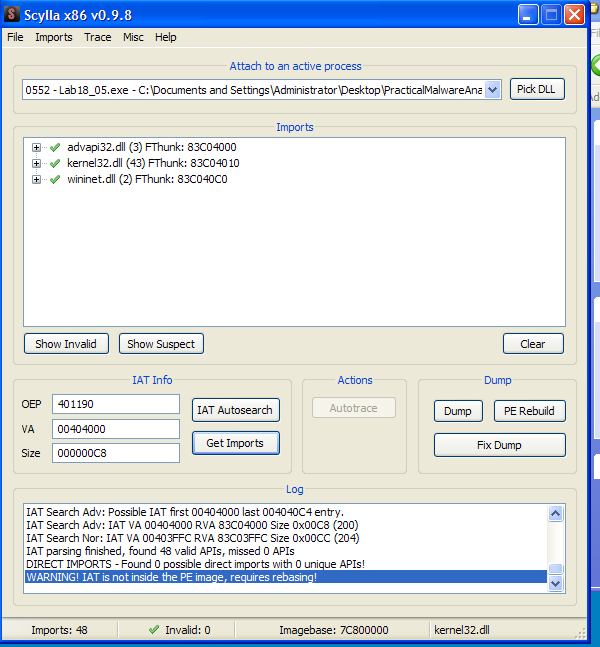
Dumping this process will only dump
kernel32.dllnot the OEP.
Setting up a software breakpoint at the OEP will not be hit because the packer might be using anti-debug checks. So instead of setting up a software breakpoint, we can instead setup a breakpoint at the OEP.
And we can see that it is hit successfully, Scylla can recognize this as the OEP. We can successfully dump the PE without any problem and reconstruction is successful.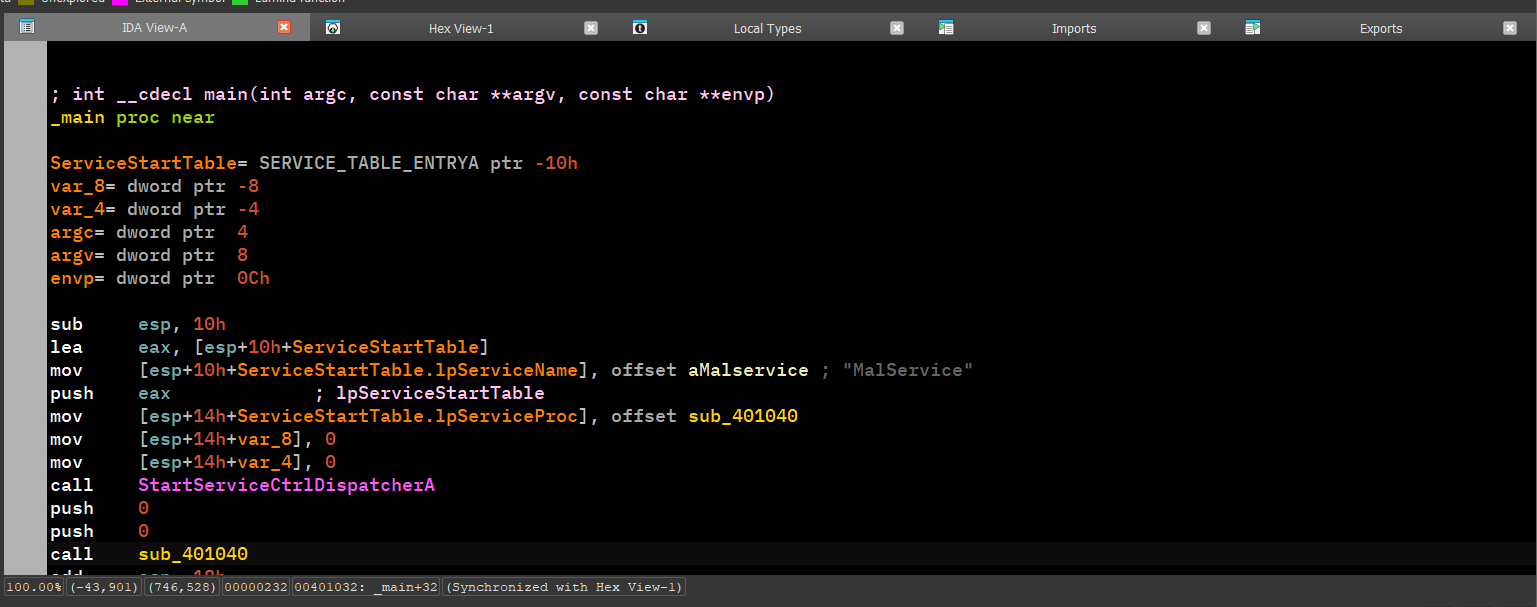
This gives the same output as the automated unpacking method, which means manual unpacking is successful.