Lab16-01.exe
Analyze the malware found in Lab16-01.exe using a debugger. This is the same malware as Lab09-01.exe, with added anti-debugging techniques.
Question 1.1
Which anti-debugging techniques does this malware employ?
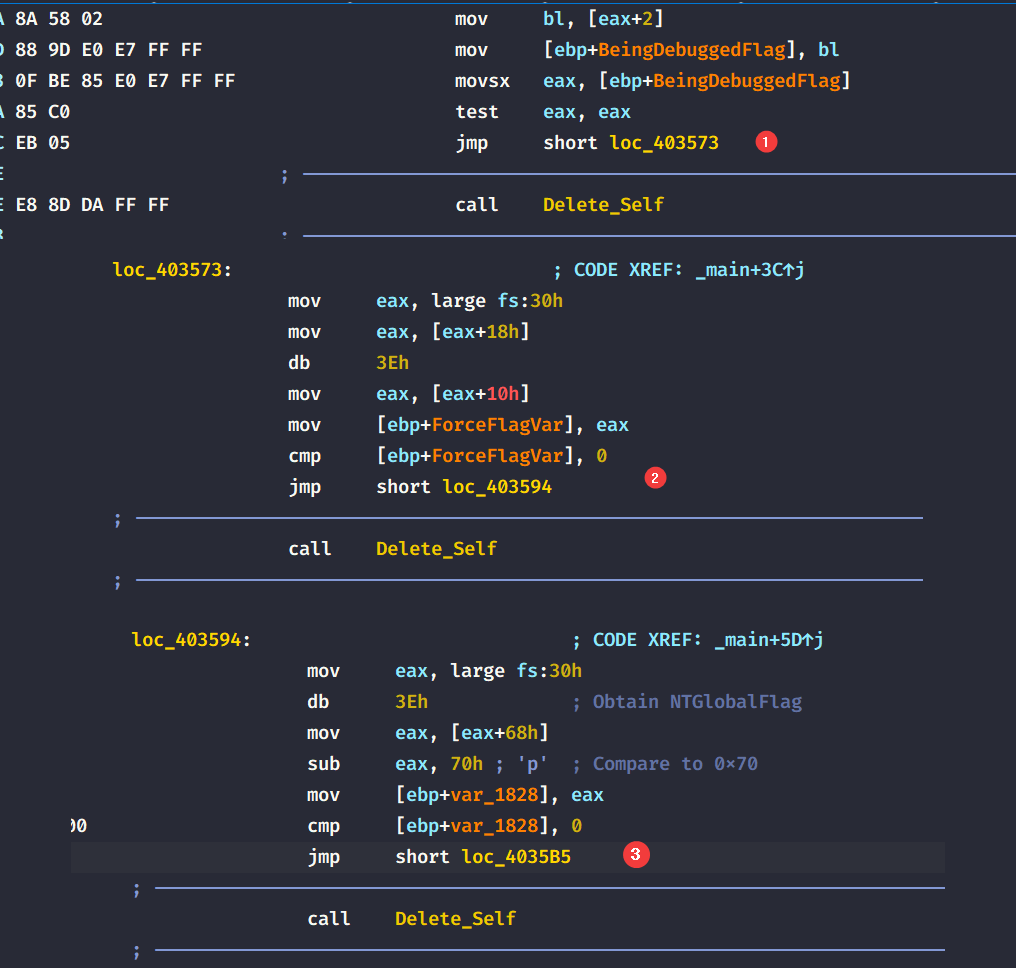
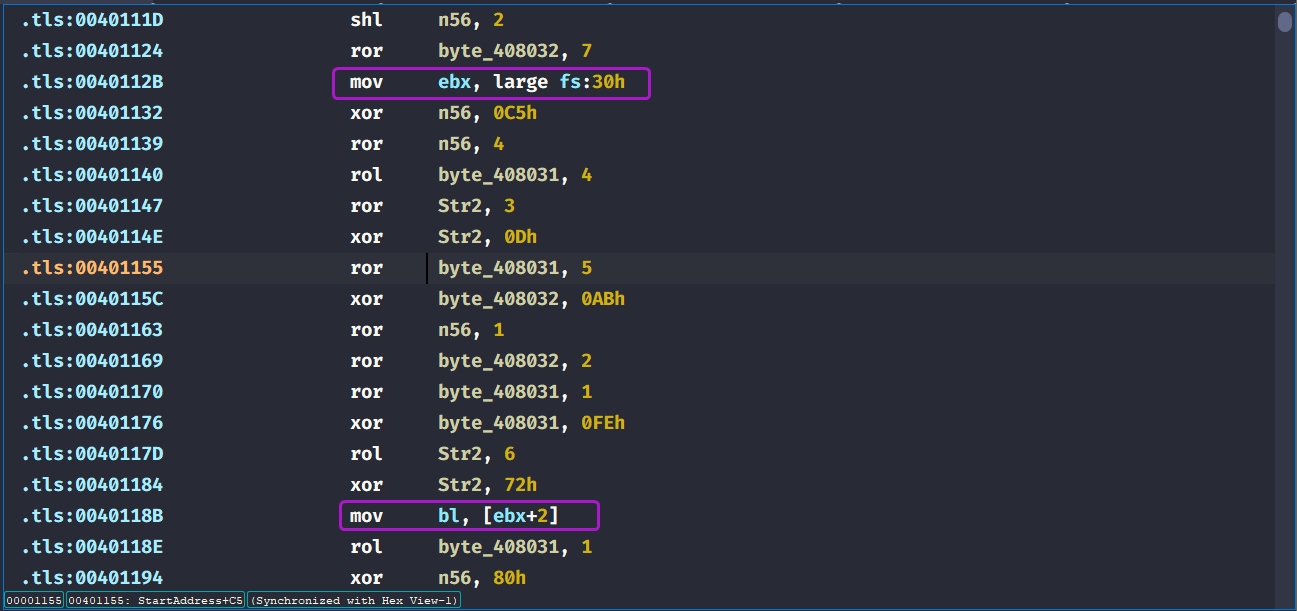
- The malware attempts to retrieve the
BeingDebuggedflag from the PEB (Process Environment Block) through the means of thefsregister.
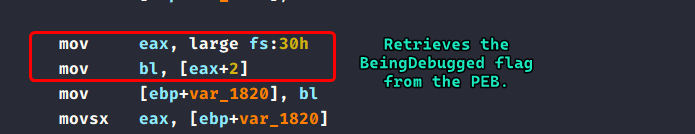
The
fsregister contains the pointer to the first member of the PEB.
Please note
The
fsregister is used to store the PEB’s pointer for x86 executables at offset0x30, while in x64 executables, thegsregister is used instead at offset0x60.
-
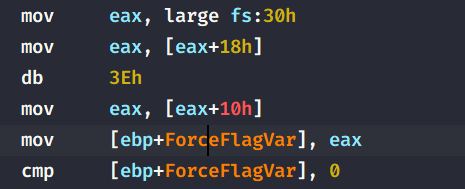
The malware attempts to retrieve the
ProcessHeappointer at offset0x18of the PEB on Windows XP and then it attempts to obtain theForceFlagfield at offset0x10which is a flag that is manipulated by the kernel if the malware is under a debugger.
Windows XP’s PEB implementation can be found here.
-
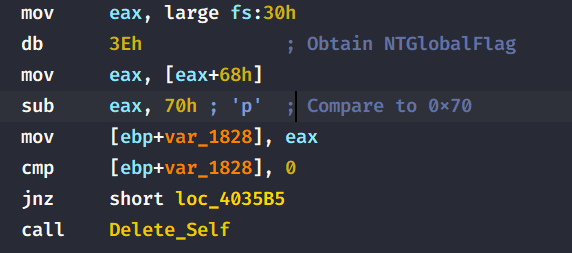
Lastly, the malware attempts to check the
NTGlobalFlagfrom the PEB and checks if it is0x70, which correlate to(FLG_HEAP_ENABLE_TAIL_CHECK | FLG_HEAP_ENABLE_FREE_CHECK | FLG_HEAP_VALIDATE_PARAMETERS). These pair of flags indicate that the malware is running under a debugger.
Question 1.2
What happens when each anti-debugging technique succeeds?
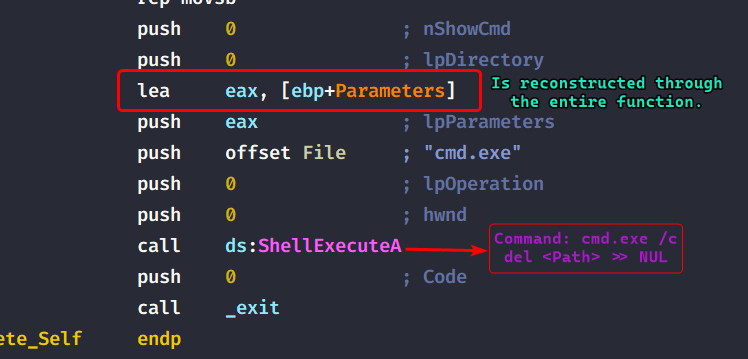
If any of the three techniques succeed, the malware calls sub_401000 (Renamed to Delete_Self) which in turn, deletes the malware from the filesystem.
It does that by obtaining the short path to the malware and then concats a few strings that will be passed as a parameter to cmd.exe which are ultimately passed to ShellExecuteA.
Question 1.3
How can you get around these anti-debugging techniques?
We can modify the flags at runtime through the debugger, or even better: we can patch the program such that we avoid the call to the self deletion function which helps us analyze the malware in the debugger without re-editing the flags each time we reset our debugging session.
Question 1.4
How do you manually change the structures checked during runtime?
Using x64dbg, we can edit the fields that the malware uses to check for debugger presence.
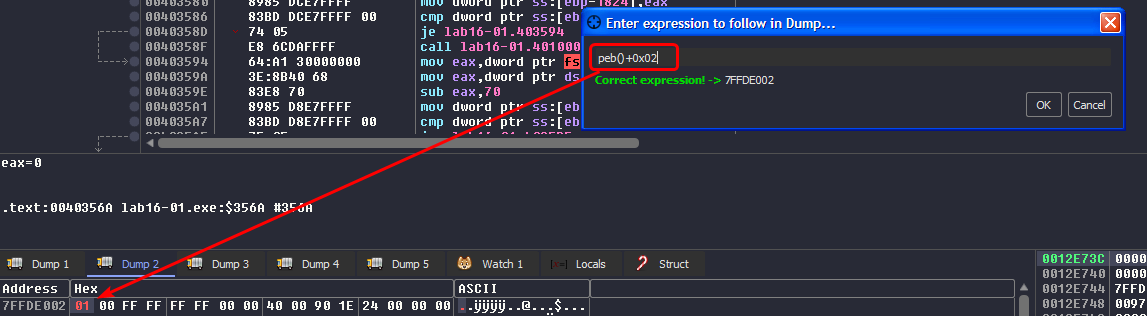
BeingDebugged Flag
We can access the PEB in x64dbg by clicking CTRL+G in a dump window and then using peb() to access the start of the PEB, we can also give it peb()+0x02 and the cursor will land on the flag directly, then we modify it to be 0.
ForceFlag Field
We use the same approach as before but the expression changes so that it matches what the malware is looking for: [peb()+0x18] and we modify the flag to be 0.
NTGlobalFlag Field
The expression for this one is peb()+0x68 and modify the flag to be anything but 0x70.
Question 1.5
Which OllyDbg plugin will protect you from the anti-debugging techniques used by this malware?
Since I’m using x64dbg, there is a plugin that helps evade anti-debug techniques called ScyllaHide, installing an x64dbg plugin is straightforward, this plugin allows us to bypass anti-debug checks based on preset profiles or we can create our own profiles.
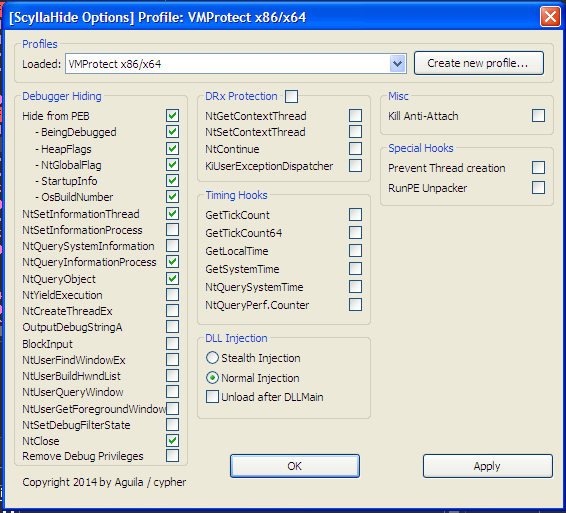
This does change all the flags on the fly once the profile is loaded and does need you to restart your debugging session.
Lab16-02.exe
Analyze the malware found in Lab16-02.exe using a debugger. The goal of this lab is to figure out the correct password. The malware does not drop a malicious payload.
Question 2.1
What happens when you run Lab16-02.exe from the command line?
The program prints out a help menu that lets the user know what parameters it takes.

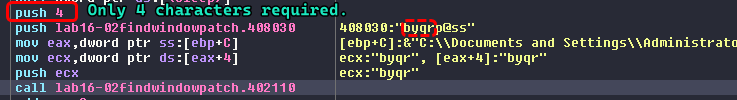
The malware asks for a 4 character password.
Question 2.2
What happens when you run Lab16-02.exe and guess the command-line parameter?
The program freezes for a millisecond and then prints out "Incorrect password, Try again.

Question 2.3
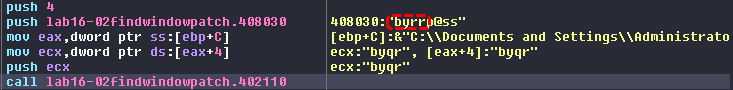
What is the command-line password?
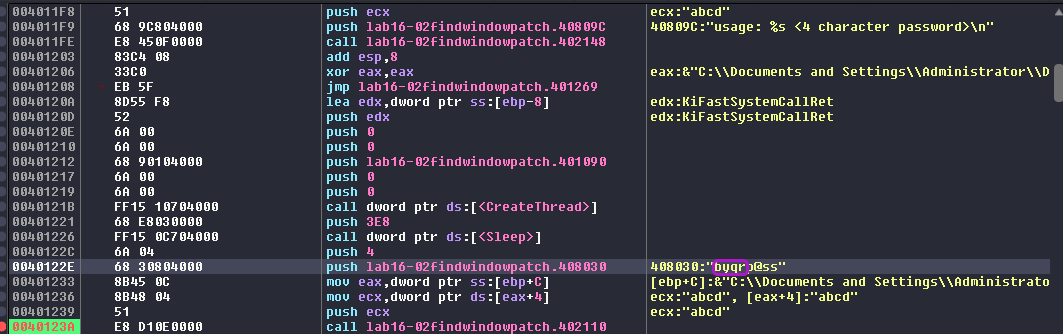
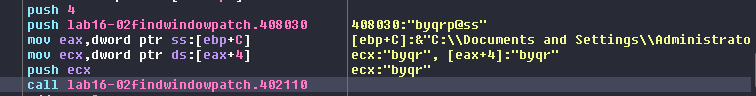
Using x64dbg and breaking at the strcmp() function, we can see that the program actually compares our input with byrrp@ss, and since it only compares the first 4 characters, the password is byqr.
Question 2.4
Load Lab16-02.exe into IDA Pro. Where in the main function is strncmp found?
The strncmp function is called within the main function at 40123A.
Question 2.5
What happens when you load this malware into OllyDbg using the default settings?
Since I’m running this in x64dbg, the program works as intended but if it were running in the Ollydbg debugger, the debugging session would have terminated.
Question 2.6
What is unique about the PE structure of Lab16-02.exe?
We can see that the PE structure contains a .tls section (Thread Local Storage) which enable the executable to run code before passing to the entry point of the program.
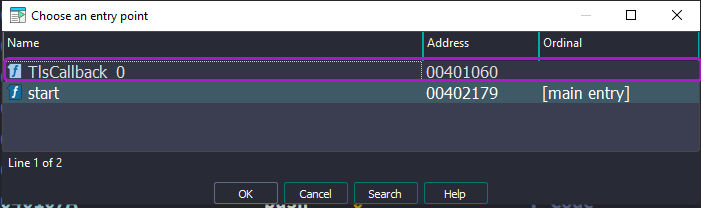
What we refer as the “entry point” means the entry point that is pointed to by the Optional Header of the PE file structure.

Question 2.7
Where is the callback located?
The .tls section begins at address 401000 but the callback that is exported and executed by the malware is at 401060.
Question 2.8
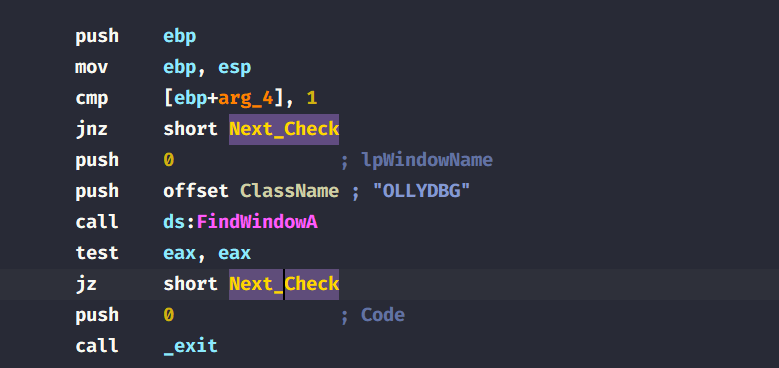
Which anti-debugging technique is the program using to terminate immediately in the debugger and how can you avoid this check?
The program attempts to check whether if a window with a name OLLYDBG, if it doesn’t find any, then it’ll jump to the next check, otherwise the malware will exit prematurely using the _exit() function. We can easily bypass this check by patching the jump instruction into an unconditional jump.
Normally when I debugged this using
x64dbg, this caused no issue for me.
Question 2.9
What is the command-line password you see in the debugger after you disable the anti-debugging technique?
After patching the jump instruction to be an unconditional, the malware seems to have the same password as before: byqr
Question 2.10
Does the password found in the debugger work on the command line?
It does not. The password byqr does not work outside the debugger but only works within.

Question 2.11
Which anti-debugging techniques account for the different passwords in the debugger and on the command line, and how can you protect against them?
After investigating, we can see that the malware creates a new thread to decode the password for us and within the decoding instructions, we can see that the malware actually uses the BeingDebugged from the PEB in it’s decoding logic.
So if we were to get the real password, we’d have to also set the BeingDebugged flag off by either using ScyllaHide or by modifying it manually.
After turning off the BeingDebugged flag, we get a different password now so if we try it in the command line:

We get the correct and real password: byrr.
Conclusion
This malware basically uses 2 anti-debug techniques (as of debugging it with x64dbg):
- Checking if an
OLLYDBGwindow exists and ends the debugging session if f. - Using the
BeingDebuggedflag in it’s decoding logic to alter the password as a way of obfuscating the real one.
Lab16-03.exe
Analyze the malware in Lab16-03.exe using a debugger. This malware is similar to Lab09-02.exe, with certain modifications, including the introduction of anti-debugging techniques.
Question 3.1
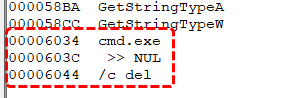
Which strings do you see when using static analysis on the binary?
We can see some references of a deletion command, possibly to self delete.
Question 3.2
What happens when you run this binary?
Nothing happens, the malware just terminates.
Question 3.3
How must you rename the sample in order for it to run properly?
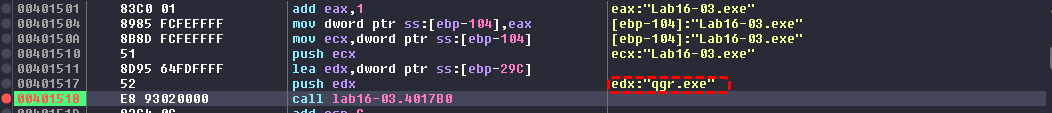
We set a breakpoint to the strncmp() function located at 401518 of the main function that takes in the executable ‘s name and the name that it expects. We can see that the debugger catches a first chance exception (division by zero)

If we continue running, we can see that the executable name it expects is actually qgr.exe and then exits. With that said, this name will not work outside the debugger.
After renaming and doing the same steps as before (we bypass the name check), the debugger stops at a first chance exception again (division by error) and then a first chance exception of memory access violation is caught and the malware crashes.

At this point I knew that single stepping in the debugger will not work, we’ll need to check all the anti-debugs checks of this malware if we want to figure out the name that it needs.
What we know thus far is that the malware uses SEH chains to obfuscate the control flow, the first one occurs at sub_4011E0 where it takes in the hardcoded string ocl.exe pointer as an argument.
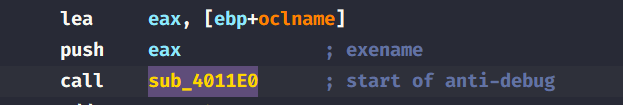
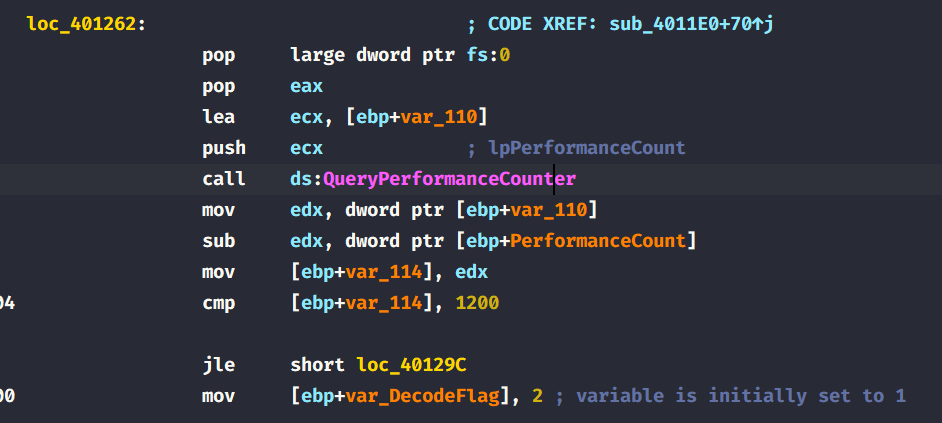
Within this function, we can see that there’s call to QueryPerformanceCounter which indicate a timing check, then the malware proceeds to setup an exception handler to handle the division by zero exception at 401243.
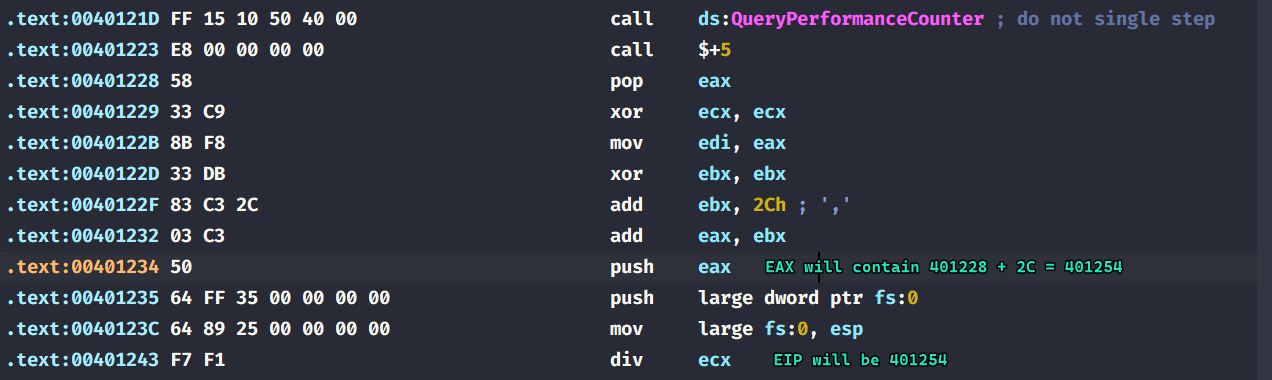
Then the malware process the division by zero exception and jumps back to 401245. (The instruction below the div ecx instruction directly)
This is done by some OS internals regarding exception handling, we basically modify the
_CONTEXTstructure that exists within the SEH chain so that when we finish “handling” our division by zero exception, we can control what the value of the instruction pointer is.
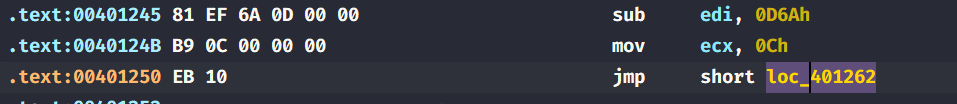
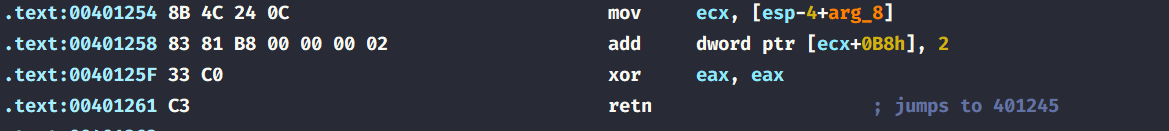
Checking the target of the immediate jump, the malware removes the exception handler it just created and then calls QueryPerformanceCounter again and calculates the time deltas between the two calls and checks if it’s less than 1200, if it is then it proceeds to decode the filename it expects from us, it changes a flag that is used within decoding to 2 and thus changing the output name.
This is very similar to how Lab16-02.exe behaved when decoding it’s password, as shown in Question 2.11.
To outcome this anti-debug check, we can patch the conditional jump to an unconditional jump as follows:
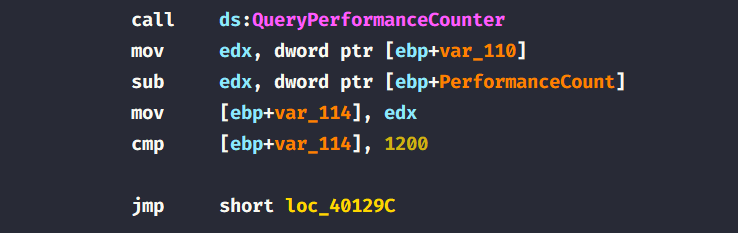
With that said, we can breakpoint back to the strncmp function and check the name that it is looking for is peo.exe.

Question 3.4
Which anti-debugging techniques does this malware employ?
The malware uses several anti-debug checks:
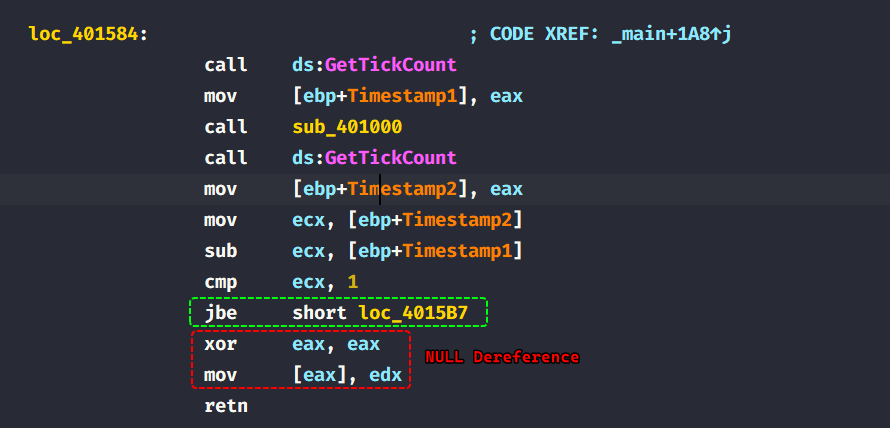
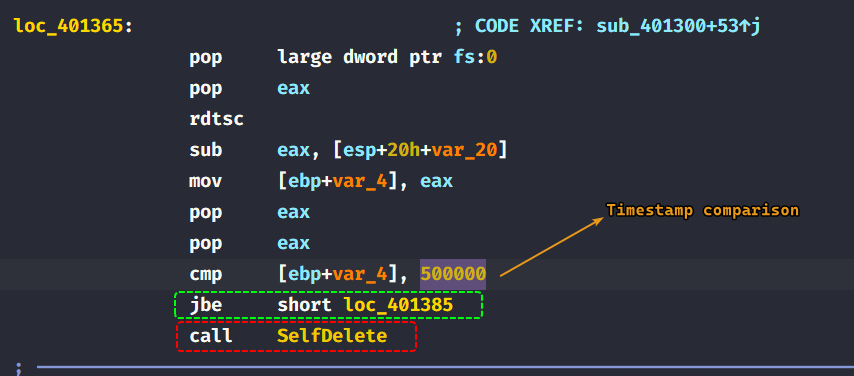
QueryPerformanceCounterwhich is used to check the time deltas between it’s calls (timing checks).GetTickCountused at401584after the name check.rdtscinstructions used insub_401300.
Question 3.5
For each technique, what does the malware do if it determines it is running in a debugger?
QueryPerformanceCounter(): Looks for a false executable name under the debugger, does not work outside the debugger.GetTickCount(): Dereferences a null pointer causing an access violation exception, which causes the malware to crash. (The debugger stops at first chance exceptions which causes the timestamp to be big.)
rdtscinstructions: If the time stamp is less than50000, then the malware calls a function that attempts to delete itself. (There was a string reference to a deletion command in Question 3.1)
Question 3.6
Why are the anti-debugging techniques successful in this malware?
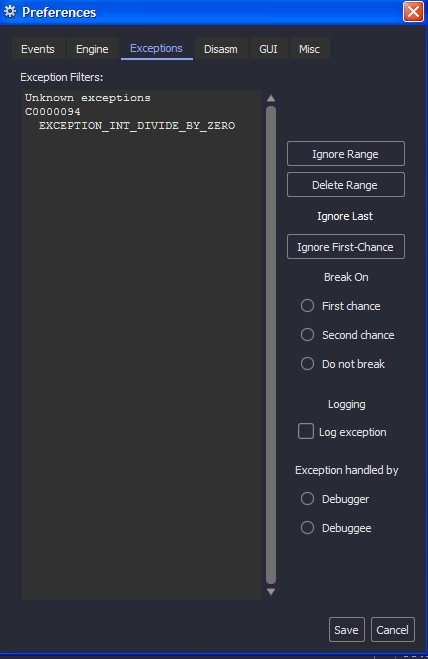
The malware can infer that it’s running in a debugger through timing checks, and debuggers by default break at first chance exceptions that are deliberate by the author in order to increase the timestamp difference in between checks, we can fix such an issue to make the debugger ignore any first chance exceptions (or in our case here, any division by zero exceptions since that the only exception that the malware invokes)
Question 3.7
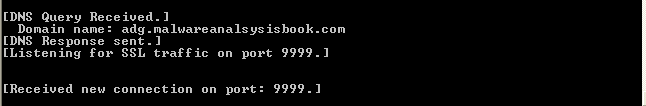
What domain name does this malware use?
We can see that the domain name that the malware beacons out to is adg.malwareanalsysisbook.com using port 9999.
Conclusion
This malware employs several anti-debug checks that can be defeated by patching any jumps to unconditional or NOP out any instructions leading to unwanted paths and also configure debuggers to skip division by zero exceptions as it uses it to increase the time deltas in between timestamp checks from which it infers that it is running through a debugger.